Geological map — definition, components, history and uses
A geological map displays the distribution, composition and structure of rock units and geologic features at Earth's surface. Covers map elements, production methods, history, map types and practical applications.
Overview
A geological map is a specialized map designed to show the distribution, identity and relationships of rock units and other geological features across an area. Rather than emphasizing roads or political boundaries, a geological map emphasizes the types of rocks, their age, and structural information such as faults and folds. It is a tool for geologists, engineers, planners and natural resource managers to visualize the subsurface in two dimensions and to plan investigations in three dimensions. For a concise definition and further context see geological features.
Image gallery
6 Images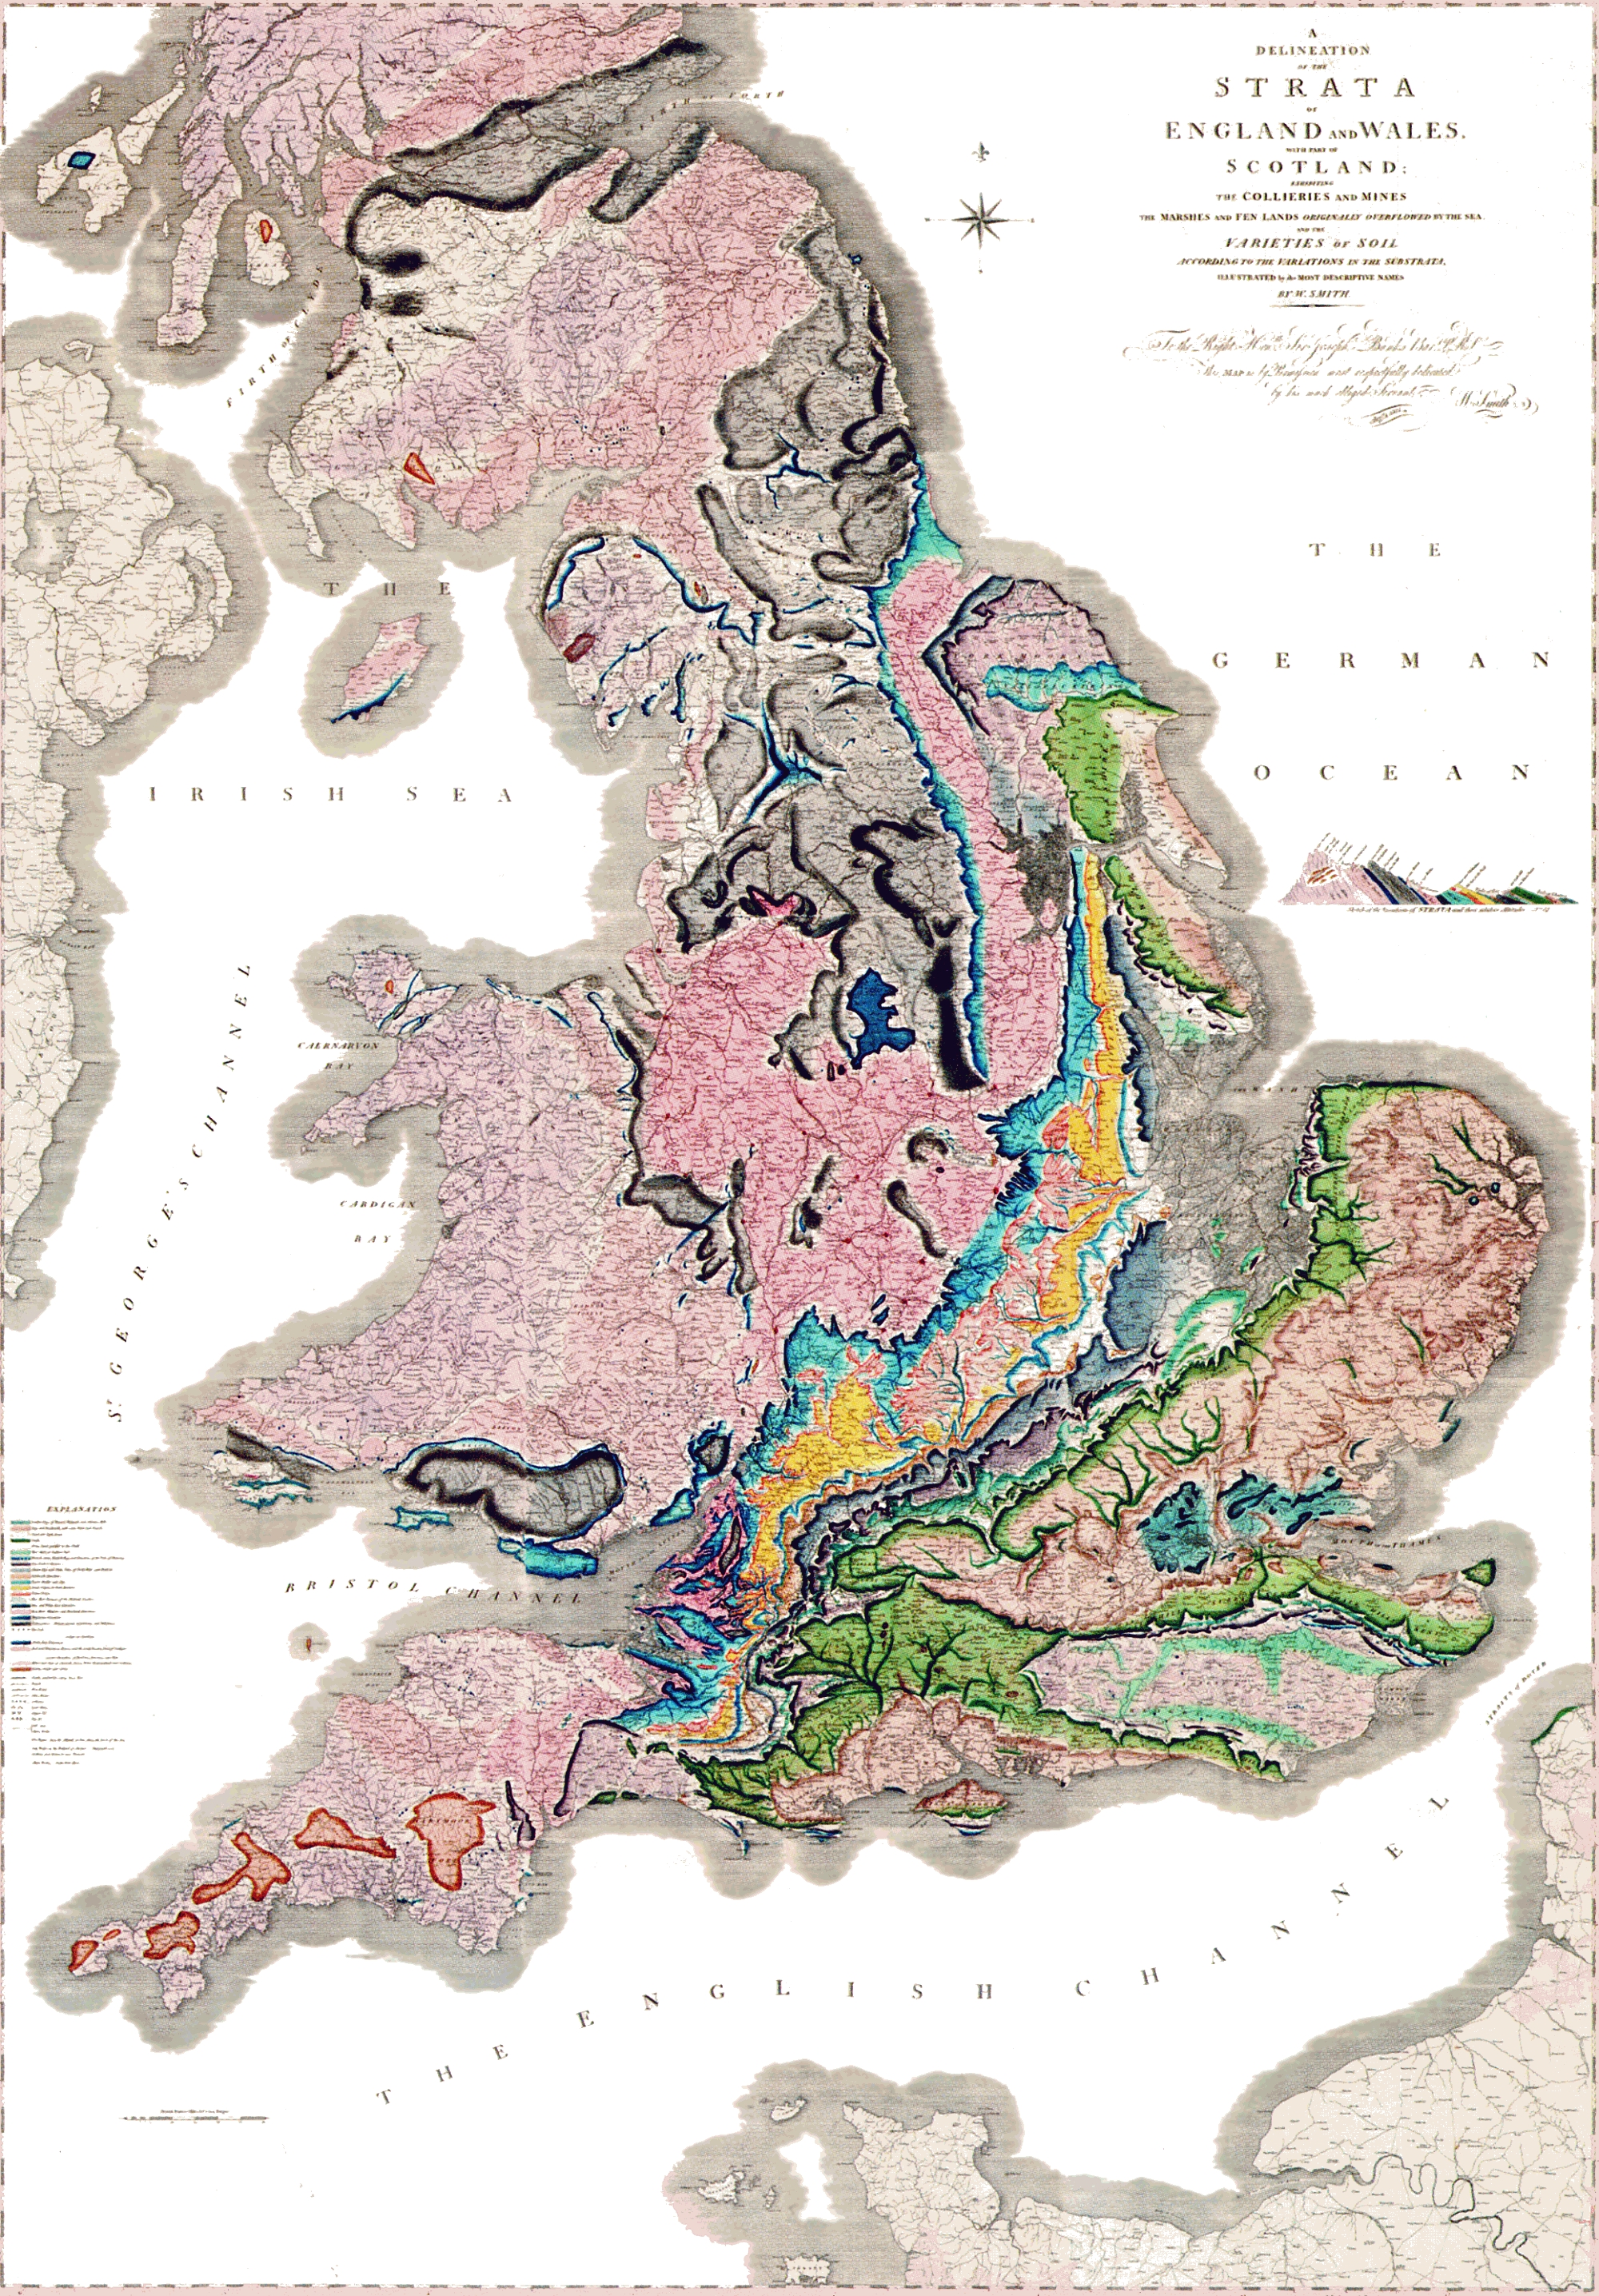


Key components and symbols
Most geological maps share a set of standard elements that communicate complex information clearly:
- Rock units and strata: Lithologies and stratigraphic units are shown with colors, patterns or labels to indicate rock type and relative age (rock, strata).
- Contacts and boundaries: Lines mark where one rock unit meets another; contacts can be shown as solid, dashed, or dotted to indicate certainty.
- Structural symbols: Faults (faults), folds (folds), and orientation markers (strike and dip) describe three-dimensional geometry.
- Legend and map scale: A legend explains unit names, colors and symbols; scale controls the level of detail.
Additional map elements and analytical lines
Beyond simple surface mapping, geological maps often include derived or supporting elements. Stratigraphic contour or structure contour lines (contour lines) show the elevation or depth of a selected bedding surface, helping to reveal subsurface geometry relative to the topographic surface (topographic). Isopach maps depict variations in thickness of a unit. Data used to compile maps can come from field observations, boreholes, geophysical surveys and aerial or satellite imagery, and modern products are frequently compiled and distributed in geographic information systems (GIS).
History and development
The idea of mapping rock types systematically dates back centuries, but the first large-scale, scientifically organized geological map for a country is commonly credited to William Smith (William Smith), who produced a map of England and Wales in the early 19th century (England). That pioneering effort demonstrated how strata occur in predictable sequences and established conventions—such as color-coding units by age—that endure in modern mapping.
Uses, types and limitations
Geological maps serve many practical and scientific purposes: mineral and hydrocarbon exploration, groundwater assessment, engineering site evaluation, hazard assessment (landslides, earthquake-related faults), land-use planning and academic research. Common map types include reconnaissance maps, detailed engineering maps, structural maps, isopach maps and thematic overlays. Despite their usefulness, geological maps have limits: erosion (erosion) can remove layers and create gaps, intense fracturing or complex deformation can complicate interpretation, and scale or data density constrain resolution. Cross-sections and supplementary data are often provided to communicate three-dimensional details that cannot be shown on a single planar sheet.
Notable distinctions and practical notes
Geological maps differ from topographic maps by focusing on rock and structure rather than relief and infrastructure. They are interpretive products that combine observation and hypothesis; different mappers may present variant interpretations where data are sparse. Modern digital mapping and GIS have enabled seamless regional compilations and interactive map services, but the core purpose remains the same: to represent Earth’s near-surface materials and structures so that users can make informed decisions about natural resources, hazards and construction.
For more targeted guidance—how to read a legend, interpret strike and dip symbols, or convert a surface map into cross-sections—consult introductory field mapping manuals or regional geological survey publications available through professional and governmental outlets (further reading).
Related articles
Author
AlegsaOnline.com Geological map — definition, components, history and uses Leandro Alegsa
URL: https://en.alegsaonline.com/art/38141