Map: Definition, Types, History, Projections, and Uses
An accessible overview of maps: what they are, their components and types, historical development, mapping technology, map projections, and common uses in navigation, science, and planning.
A map is a visual representation that shows the location, form, or relationships of features in a chosen area. Most maps portray portions of the Earth, but the term also applies to representations of other planets, the night sky and abstract spaces. Unlike a raw photograph, a map interprets information: it generalizes, symbolises and organizes data so that people can read patterns, distances and directions. Cartographers—mapmakers—combine observation, measurement and design to produce maps suitable for particular tasks and audiences (cartographers).
Image gallery
10 Images


Characteristics and common elements
Every map usually includes scale, a legend or key, orientation (often north arrow), and symbols that stand for real-world features. Maps may be topographic, showing elevation and terrain; thematic, emphasizing a single topic such as population or climate; or navigational, focused on routes and hazards. Modern maps can be printed on paper or displayed on a computer screen or mobile device. Behind many digital maps are geographic information systems—GIS—which store spatial data in a location-oriented database.
- Scale: relationship between map distance and real distance.
- Projection: method for representing the curved surface of the Earth on a flat plane (map projections).
- Legend: explanation of symbols and colors.
- Title and metadata: what the map shows and how it was produced.
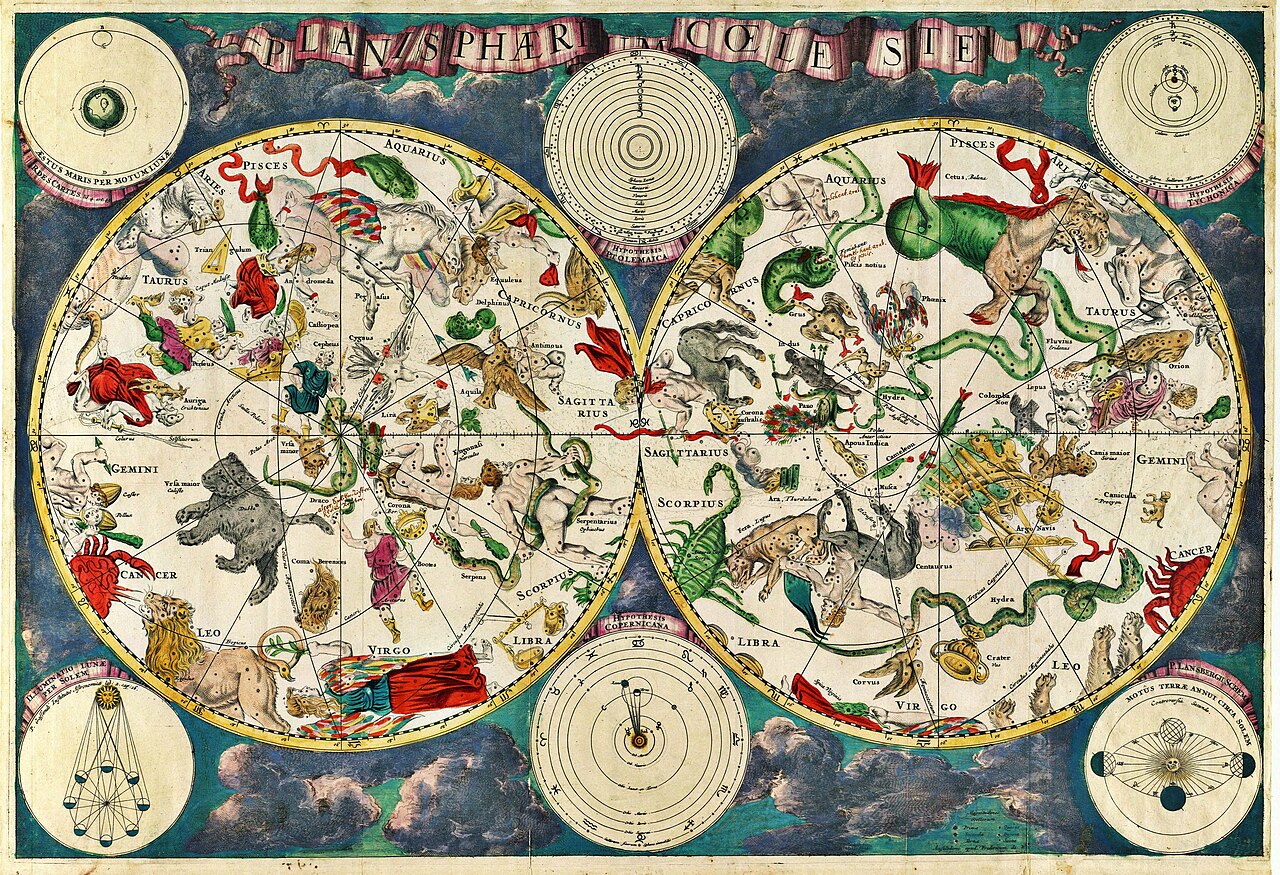
Maps come in names that reflect their use: nautical and marine maps are often called charts, and celestial representations are known as star charts. The word "map" can also describe conceptual sketches and diagrams—simple drawings that show relationships among ideas, people or events; such diagrams are frequently described with terms like "mind map" or "site map" on the web.
Brief history and development
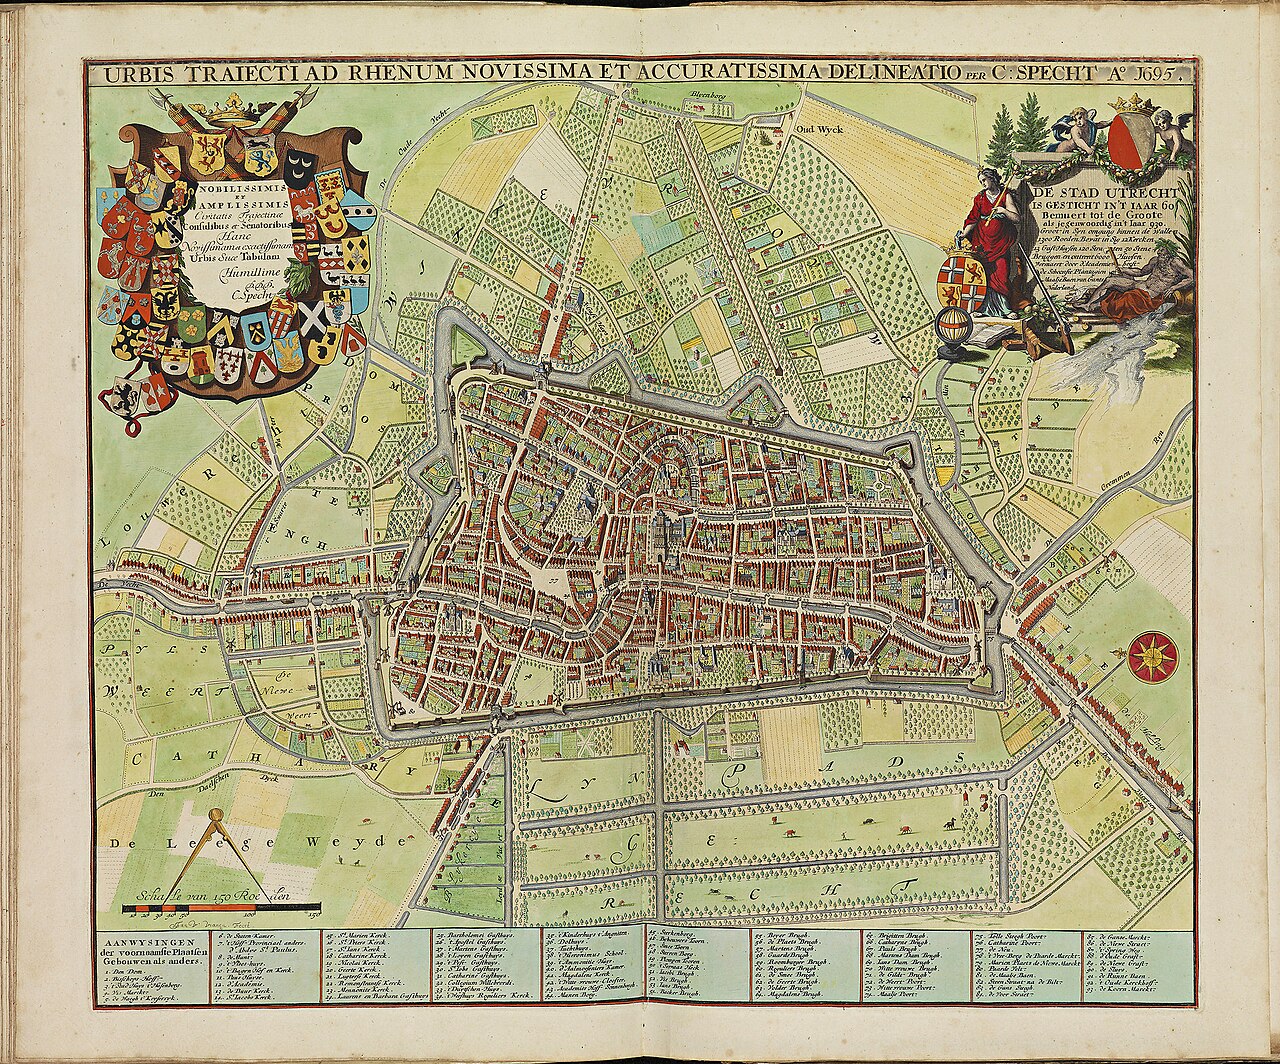
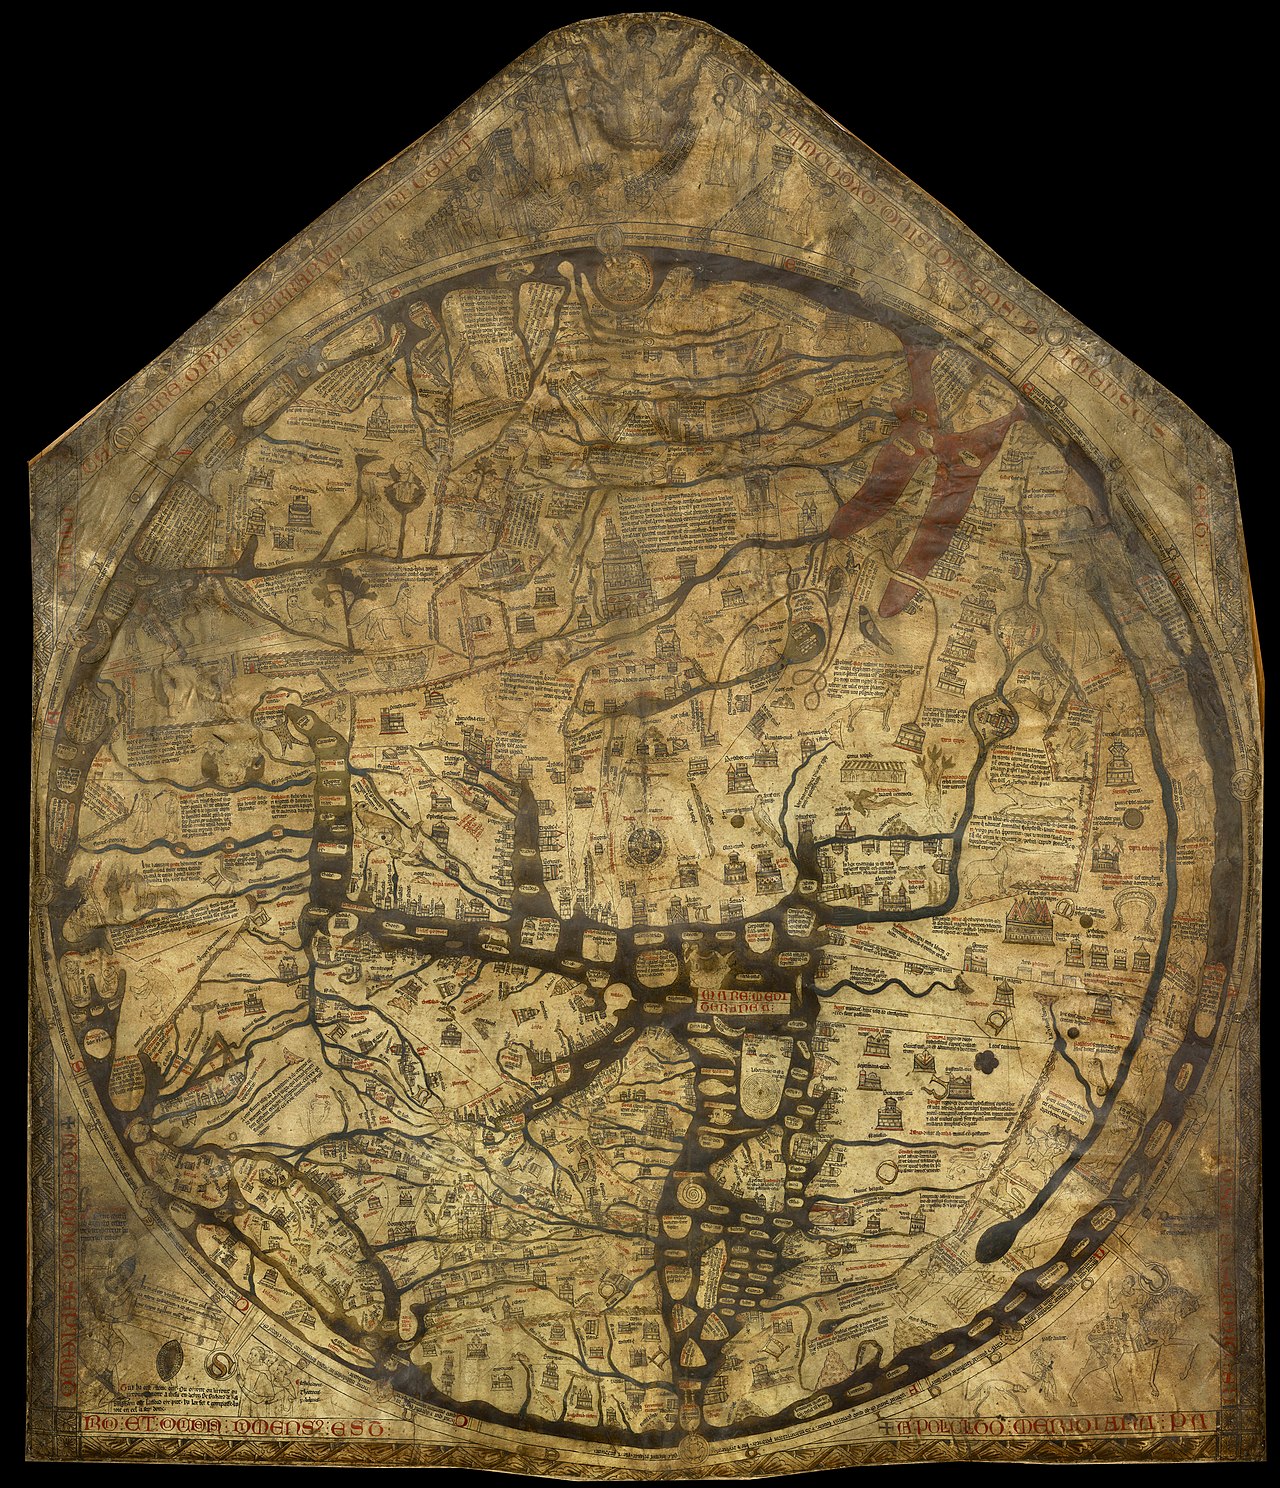
People have made maps for thousands of years, from early carved or painted schematics to the detailed portolan charts used by sailors. Over time tools improved: surveying, triangulation and astronomical observations increased accuracy, while mathematical advances formalized projections. The practice evolved from artisanal mapmaking to scientific cartography supported by institutions and printing. Even as digital mapping grows, traditional skills remain important for design and interpretation.
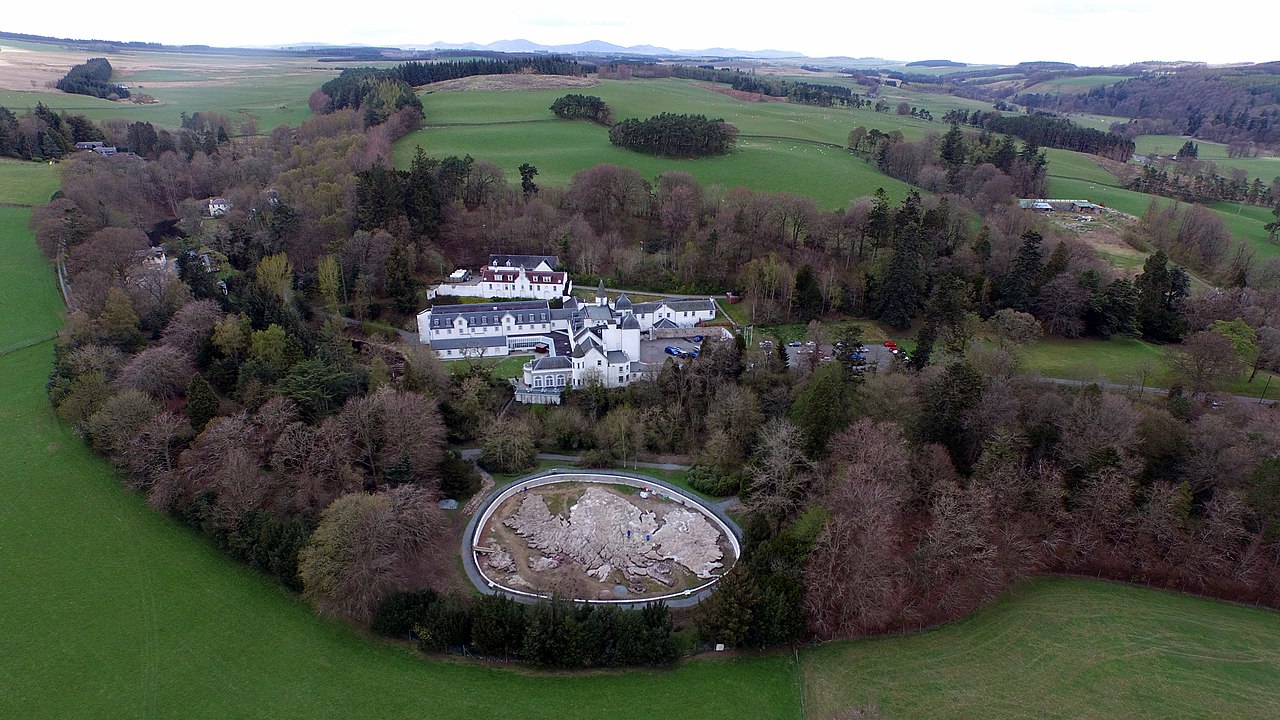
In the late 20th and 21st centuries, satellite imagery, aerial photography and automated sensors greatly expanded the sources available to mappers. Yet a map is always an interpretation, not a direct copy: choices about what to include, how to symbolize features, and which projection to use affect how information is perceived.
Uses, examples, and importance
Maps serve many functions: navigation and transportation, land-use planning, environmental management, emergency response, education and scientific research. Specialized forms include nautical charts for safe navigation at sea, nautical charts; astronomical star charts for locating celestial objects; and thematic maps that reveal patterns in demographics, economics or ecology. In digital contexts, developers provide a "site map" to list pages and their relationships on a website (site map), while urban planners analyze layered GIS datasets to guide decisions.
Some maps are interactive and continuously updated; others are static printed works. A globe—a three-dimensional model of the Earth—is the only way to show the planet without projection distortion, but globes are less convenient for many tasks than flat maps (globe).
Map projections and distortions
Because the Earth is roughly spherical, representing it on flat media requires a projection based on mathematical formulas. Different projections prioritize preserving shape, area, distance or direction, but none preserve them all. The choice of projection involves mathematics and trade-offs: cylindrical projections keep consistent direction for navigation, while equal-area projections are preferred for comparing regions by size. Awareness of projection effects is essential for accurate interpretation.
Maps also connect to broader ideas: they can be charts of events and relationships (chart), schematics showing relationships between elements, or practical tools for transportation and commerce. Whether printed or digital, maps remain fundamental instruments for understanding and managing space.
For more technical introductions and examples, consult specialized resources on cartography, GIS and projection theory (map projections, GIS, spatial databases). Historical atlases and collections also illustrate how mapping styles and purposes have changed through time.
Additional reading and online resources are available for each subtopic, including practical guides to using maps, designing legends and choosing projections (star charts, nautical charts, paper mapping, drawing, computer mapping, and summaries of the work of cartographers).
Questions and answers
Q: What is a map?
A: A map is an image of an area, usually of the Earth or part of the Earth. It includes interpretation and can be seen on paper, smartphones, computers, or other digital devices.
Q: What is the difference between a map and an aerial photograph?
A: A map includes interpretation while an aerial photograph does not.
Q: What are some examples of charts?
A: Examples of charts include star charts and nautical charts.
Q: Who makes maps?
A: Cartographers make maps. Many maps today are made using GIS computer systems which are database systems that are organized by location instead of named records.
Q: How do you project a map onto paper or a computer screen?
A: You have to use mathematics to project a map onto paper or a computer screen because the Earth is round and paper and screens are flat.
Q: Is there any kind of map that doesn't need to be projected?
A: Yes, a map drawn on a sphere called a globe does not need to be projected.
Q: What do web developers call lists of web pages on websites?
A: Web developers call lists of web pages on websites site maps.
Related articles
Author
AlegsaOnline.com Map: Definition, Types, History, Projections, and Uses Leandro Alegsa
URL: https://en.alegsaonline.com/art/61505