Absorption spectroscopy: principles, instruments, and applications
Overview of absorption spectroscopy: how matter absorbs light, the physical basis, instrument types, historical milestones, and common analytical and astronomical uses.
Absorption spectroscopy is an experimental technique that determines what a sample contains by measuring which wavelengths of electromagnetic radiation are absorbed as the radiation passes through the material. In its simplest form a broad-spectrum beam—visible light, ultraviolet (UV), or infrared (IR)—is directed through a gas, liquid or solid and a detector records the intensity that remains at each wavelength. The missing or reduced portions of the transmitted spectrum are diagnostic features: narrow absorption lines for isolated atoms and simple molecules, or broader bands for more complex molecular vibrations and electronic transitions. See also sample definitions and the role of chemical analysis.
Image gallery
9 Images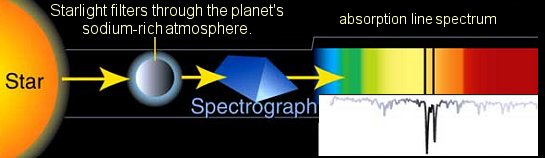


Physical principles
At the atomic and molecular level, absorption occurs because particles can take up photon energy and move from a lower to a higher internal energy state. Electrons in atoms and molecules occupy discrete energy levels, so only photons whose energy matches the gap between two levels will be absorbed. The photon energy is related to its frequency by the Planck relation E = h f, where h is Planck's constant and f is frequency; equivalently, specific wavelengths correspond to specific transition energies. For molecules, additional degrees of freedom—rotational and vibrational modes—produce a richer set of allowed transitions and thus broader absorption bands compared with atomic spectra. For brief background on the microscopic particles involved, see electrons and atoms. The intensity reduction as a function of wavelength defines an absorption spectrum.
Types of absorption spectroscopy and common instruments
Absorption spectroscopy covers a range of methods tuned to different energy regions and analytes. Typical categories include:
- UV–visible (UV–Vis): electronic transitions in atoms and conjugated molecules; often used with a spectrophotometer for concentration measurements.
- Infrared (IR) and Fourier-transform IR (FTIR): vibrations and rotations of molecules yield characteristic bands used in organic and materials analysis.
- Atomic absorption spectroscopy (AAS): individual atoms are produced in a flame or furnace and their narrow atomic lines identify and quantify metals such as metal contaminants and trace elements.
- Differential and tunable laser absorption: high-resolution methods for gases, including atmospheric monitoring and combustion diagnostics.
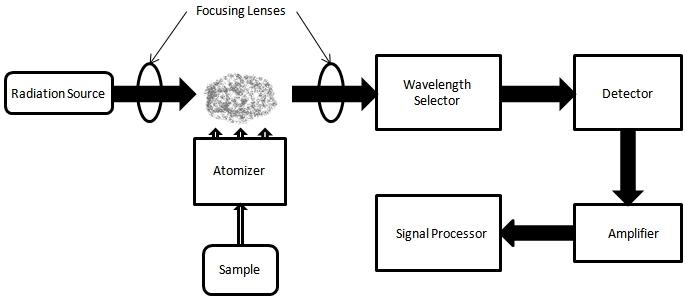
Basic instrument components are a light source, wavelength selector (monochromator or tunable laser), sample compartment and a detector. Modern instruments often include fiber optics, digital data acquisition and software for spectral processing and quantitative analysis.
History and development
Observations of dark lines in sunlight date from the early 19th century when Joseph von Fraunhofer mapped spectral lines. In the mid-19th century, Gustav Kirchhoff and Robert Bunsen linked those lines to specific chemical elements, establishing spectroscopy as a chemical identification tool. In the 20th century the quantum theory of atoms explained why transitions are discrete and allowed the Planck relation to be applied quantitatively. Advances in optical components, detectors and lasers expanded absorption spectroscopy into many practical fields.
Applications and examples
Absorption spectroscopy has broad scientific and industrial use. In analytical chemistry (chemistry) it quantifies concentrations using the Beer–Lambert law: absorbance is proportional to concentration and path length. In astronomy, stellar and planetary atmospheres are studied by comparing observed absorption features to laboratory spectra of known elements and molecules, revealing composition, temperature and motion. Environmental monitoring relies on selective gas absorption for pollutants; medical devices use near-IR and UV wavelengths for blood oxygen and biochemical assays; and process control uses inline absorption sensors to maintain product quality.
Limitations and distinguishing points
Absorption measurements can be limited by overlapping features, low sample concentration, scattering, or matrix effects that obscure analyte signals. High resolution separates narrow lines while broadband instruments resolve molecular bands. Absorption spectroscopy differs from emission spectroscopy: absorption records what wavelengths are removed from a transmitted beam, while emission detects radiation produced by excited samples. Careful calibration, reference spectra and attention to instrument line shape are essential for reliable interpretation.
For practical implementation and additional resources, consult instrument manufacturers and standard reference texts or technical notes such as the summaries and application notes accessible via electron transition discussions and specialized repositories at atomic data portals. Further overviews and protocols can be found through introductory guides at photon basics, historical reviews at spectroscopy histories, and applied technique pages for sample preparation and analytical methods.
Readers interested in implementation details—such as detector selection, baseline correction, and quantitative calibration—will find specialized tutorials and standards from instrument vendors and professional societies useful; cross-references are available via pages on fundamental constants and regulatory guidance for chemical testing and metal analysis.
Tags
Related articles
Author
AlegsaOnline.com Absorption spectroscopy: principles, instruments, and applications Leandro Alegsa
URL: https://en.alegsaonline.com/art/519
Sources
- andor.oxinst.com : "Absorption / Transmission / Reflection Spectroscopy - Andor Learning Centre"
- hyperphysics.phy-astr.gsu.edu : "HyperPhysics"