Spectroscopy: study of matter via interaction with electromagnetic radiation
Spectroscopy examines how matter absorbs, emits or scatters electromagnetic radiation to reveal composition, structure, temperature, motion and other physical properties across many scientific fields.
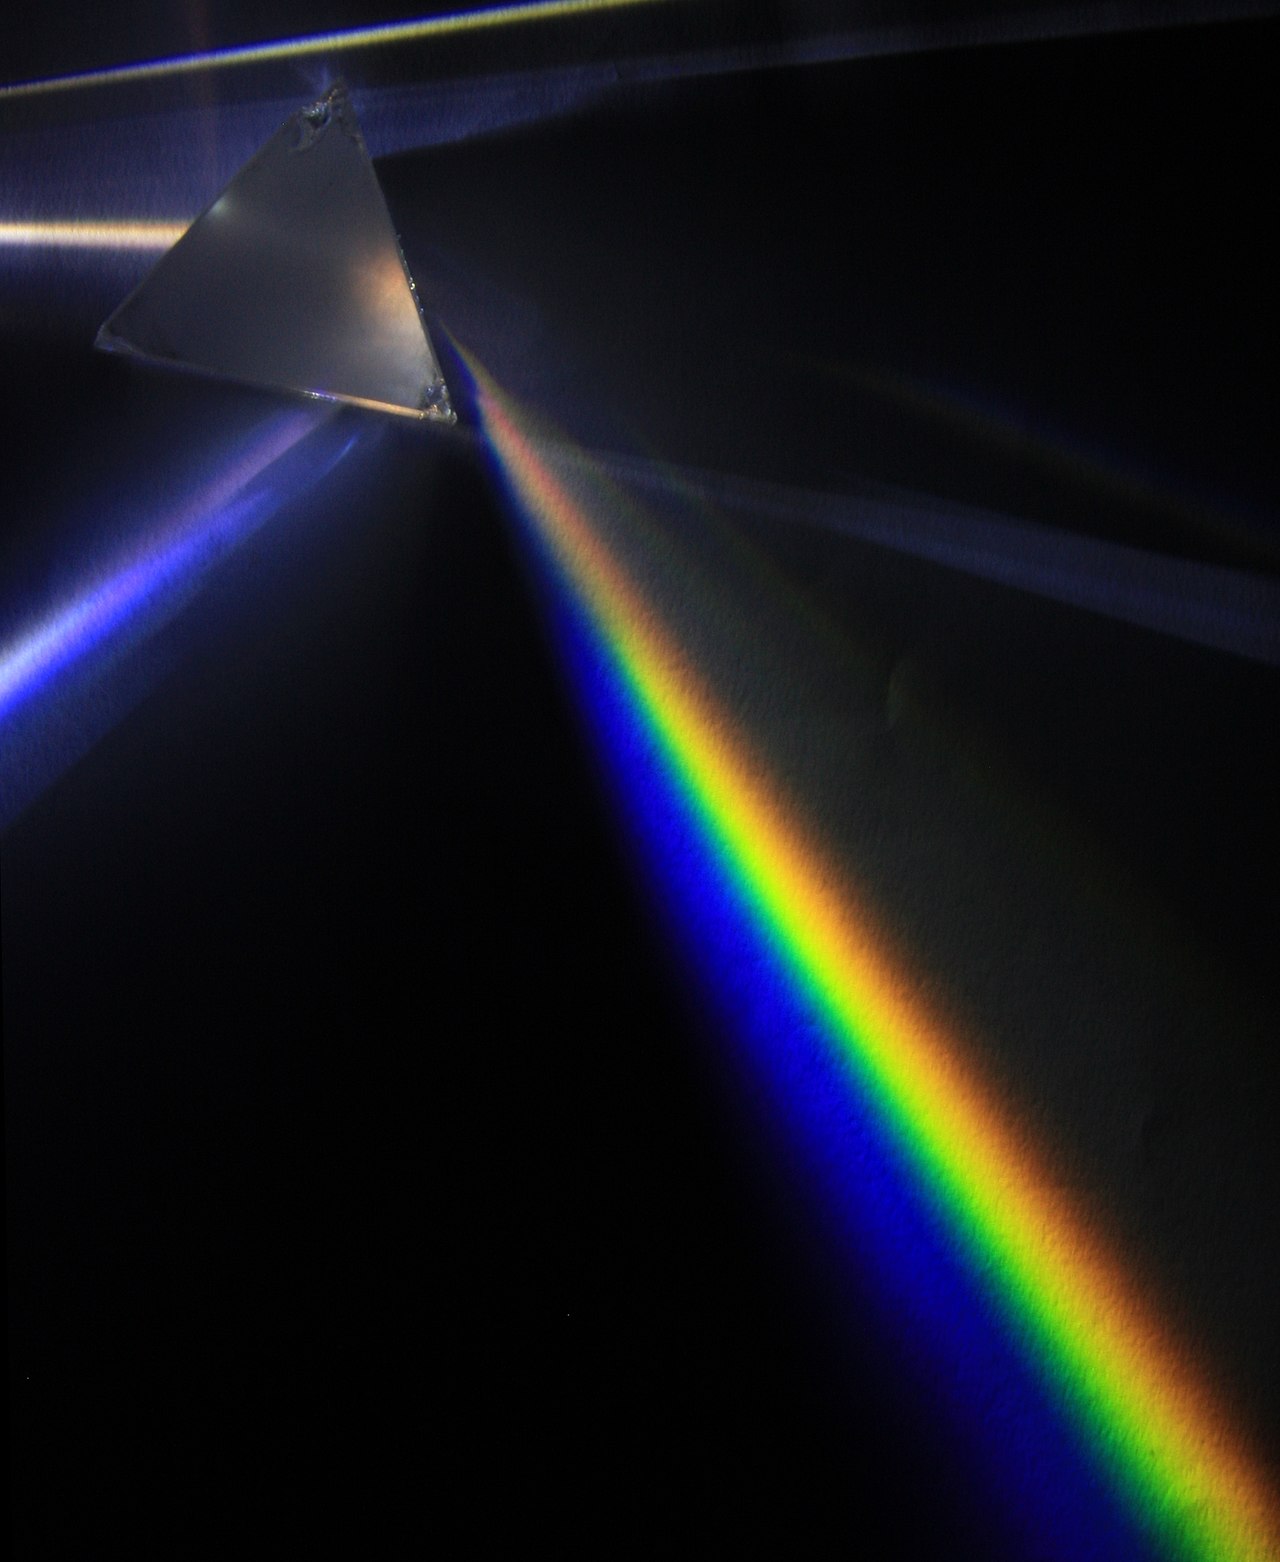
Spectroscopy is the study of how matter interacts with electromagnetic radiation across wavelengths from radio waves to gamma rays. Instead of forming a conventional image, spectroscopic methods separate radiation by wavelength or frequency to produce a spectrum: a record of intensity versus wavelength. That spectrum encodes information about the identity of atoms, ions and molecules, their energy levels and transitions, as well as macroscopic properties such as temperature, pressure and velocity. Instruments used for these tasks are commonly called spectrometers or spectrographs; for basic introductions to the nature of electromagnetic radiation see light and electromagnetic waves.
Image gallery
10 Images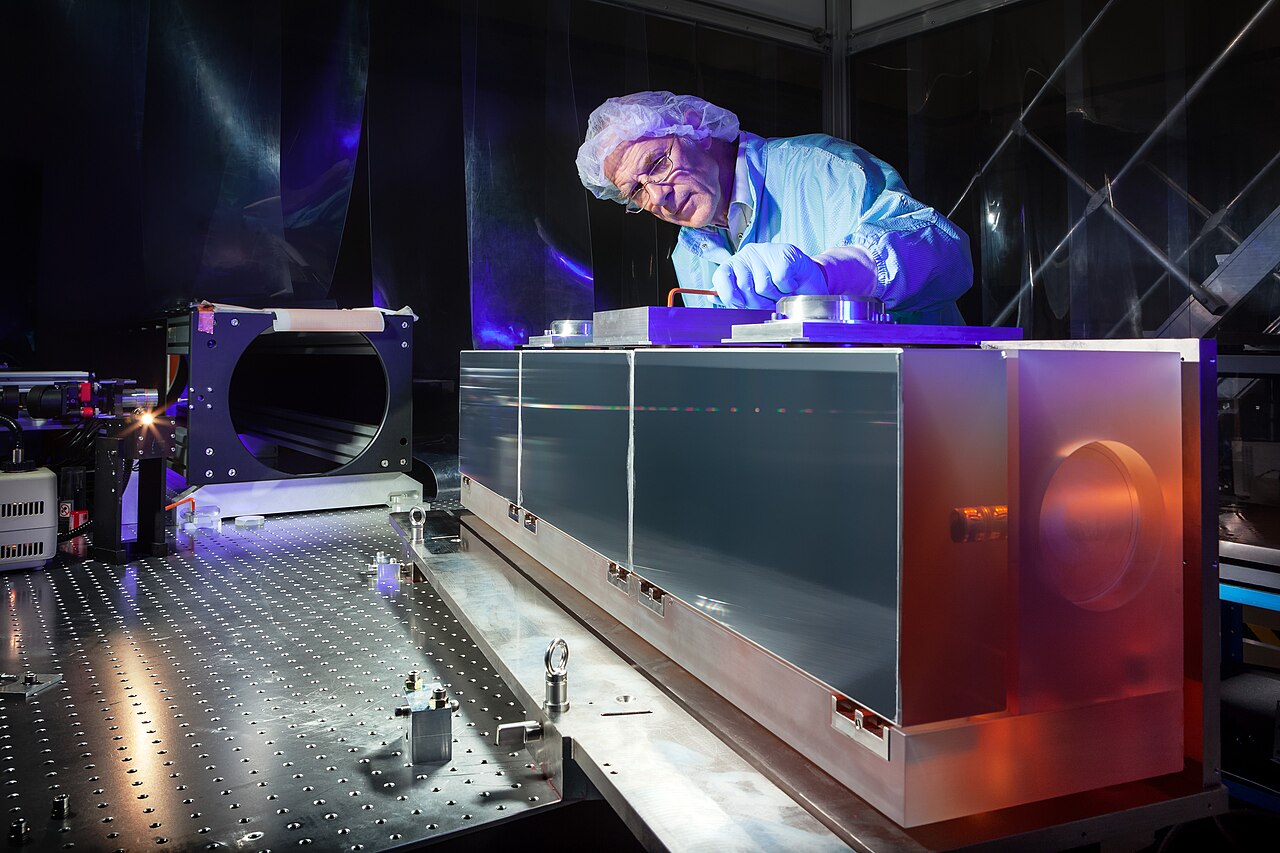


Basic principles
At the quantum level, electrons and molecular vibrations occupy discrete energy states. Transitions between these states absorb or emit photons with energies equal to differences between levels, producing characteristic spectral lines or bands. Selection rules, line strengths and molecular structure determine which transitions are allowed and how intense they are. Continuous spectra may arise from hot dense sources, while line spectra appear from tenuous gases. Wavelength shifts produced by motion (Doppler effect) and cosmological expansion alter observed positions of features and are key diagnostics in astronomy; see practical notes at observational techniques.
Instrumentation and measurement
Spectroscopic setups include dispersive elements (prisms, gratings), interferometers, monochromators and detectors tuned to particular ranges. Calibration using known reference lines, correction for instrumental response and subtraction of background signals are routine. Resolution, sensitivity and signal-to-noise ratio determine the smallest features that can be reliably measured. Modern instruments couple optics with electronics and software for data acquisition, reduction and visualization; technical guides are available at instrumentation guides.
Major techniques
- Absorption and emission (UV–visible): identify elements and electronic transitions; used in chemistry and astronomy. Further reading: UV–Vis resources.
- Infrared (IR) and Raman: probe molecular vibrations and chemical bonds; widely used in organic analysis and materials science. Practical summaries at IR and Raman summaries.
- Nuclear magnetic resonance (NMR): exploits nuclear spin transitions in magnetic fields to determine molecular structure and dynamics; see NMR overviews.
- X‑ray spectroscopy (XPS, XAS): examines core electrons and local chemical environment, valuable in surface and solid‑state chemistry; technical notes at X‑ray technique overviews.
- Laser and time‑resolved spectroscopy: enable high sensitivity and study of ultrafast processes; experimental approaches are summarized at laser spectroscopies.
Spectral shapes and physical effects
Line profiles reflect natural broadening, thermal (Doppler) broadening, collisional broadening and instrumental effects. Isotopic shifts, hyperfine structure and Zeeman splitting in magnetic fields give additional diagnostic detail. Quantitative analysis uses models of line formation and radiative transfer in optically thick or thin media. For applied examples and case studies consult application notes.
Applications
Spectroscopy is foundational across sciences: in chemistry for identifying functional groups and concentrations; in astrophysics for determining composition, temperatures and velocities of stars and galaxies; in environmental monitoring for measuring pollutants; in medicine for diagnostic imaging and metabolic studies; and in industry for quality control and process monitoring. Combined approaches such as hyperspectral imaging merge spatial and spectral information for remote sensing and material identification.
History, limitations and future directions
From early observations of spectral lines in sunlight and heated gases to modern lasers and detectors, spectroscopy has evolved with advances in optics and electronics. Limitations include overlapping features in complex mixtures, sensitivity thresholds and interpretation ambiguities; these are being addressed by higher resolution instruments, time‑resolved methods and computational analysis including machine learning. For deeper technical and historical context see additional resources at further reading.

List of spectroscopy types and methods in analytics
- Atomic spectroscopy - measurements of the properties of individual atoms, especially their electron energy levels
- Atomic Absorption Spectroscopy (AAS/OAS)
- Flame Technology
- Graphite Tube Technology
- Hydride Technology
- Atomic emission spectrometry (AES/OES)
- Inductively coupled plasma (ICP-OES)
- Microwave Plasma Torch AES (MPT-AES)
- Atomic fluorescence spectroscopy (AFS)
- Gamma spectroscopy
- Disturbed gamma-gamma angle correlation (PAC spectroscopy)
- Mößbauer spectroscopy (based on the Mößbauer effect)
- Electron Spectroscopy
- Photoelectron spectroscopy with X-rays (XPS)
- Photoelectron spectroscopy with UV light (UPS)
- Angle-resolved photoelectron spectroscopy (ARPES)
- Auger electron spectroscopy (AES)
- Electron Energy Loss Spectroscopy (EELS)
- X-ray spectroscopy (XRS)
- X-ray fluorescence analysis (XRF)
- X-ray diffraction (XRD)
- X-ray absorption spectroscopy (XAS)
- Glow discharge spectroscopy (GDOES)
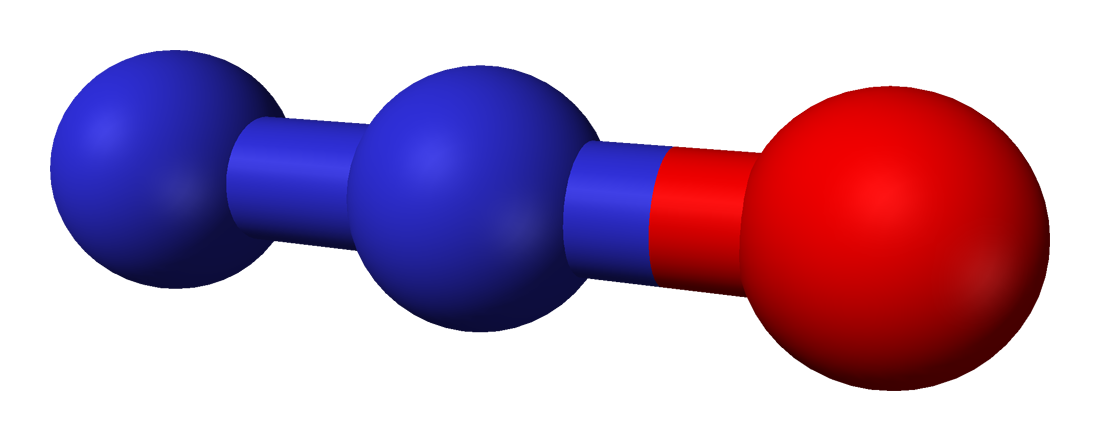
- Molecular spectroscopy - measurements of the properties of single molecules, especially valence electron energy levels and molecular vibrations and rotations
- Frequency modulation spectroscopy
- Fluorescence spectroscopy
- Single molecule fluorescence spectroscopy
- Fluorescence correlation spectroscopy
- Vibrational spectroscopy
- Infrared spectroscopy (IR)
- Ultraviolet spectroscopy (UV)
- Raman spectroscopy
- Terahertz spectroscopy
- Nuclear magnetic resonance spectroscopy (NMR, also high frequency spectroscopy)
- CIDNP spectroscopy (also NMR-CIDNP spectroscopy)
- Electron spin resonance (ESR/EPR)
- Electron Nuclear Double Resonance (ENDOR)
- Microwave spectroscopy
- UV/VIS spectroscopy (UV/Vis)
- Solid state spectroscopy - measurements of the properties of whole solids (like crystals), especially their band structure details
- Absorption or transmission spectroscopy
- Reflectance spectroscopy
- photoconductive spectroscopy, see photoelectric effect#internal photoelectric effect
- Impedance spectroscopy (dielectric spectroscopy)
- Laser spectroscopy
- Cavity-ring-down spectroscopy (CRDS, also CRLAS)
- Laser Induced Fluorescence (LIF)
- Ultrafast spectroscopy - measurements of the details of fast processes, especially chemical reactions
Spectroscopy in astronomy
The absorption lines in the solar spectrum were named after Josef Fraunhofer, who discovered them in 1813. But it was not until 1859 that Gustav Kirchhoff and Robert Bunsen were able to explain the nature of these lines as fingerprints of elements in the solar atmosphere. In the following further development of spectral analysis, William Huggins (USA) and Angelo Secchi (Vatican Observatory), among others, succeeded in the systematic investigation of stellar spectra and the temperature-dependent classification of stars.
Spectral analysis of the light from the Sun and other stars showed that the celestial bodies are composed of the same elements as the Earth. However, helium was first identified by spectroscopy of the sun's light. One of the solar spectral lines could not be assigned to any known substance for decades, so that until the earthly occurrence was proven, it was assumed that an unknown element existed on the sun (Greek: Helios).
Other classical successes of astronomical spectral analysis are
- the detection of the Doppler effect on stars (see also radial velocity)
- and (around 1920) on galaxies (see redshift),
- the exact photographic analysis of the star Tau Scorpii by Albrecht Unsöld in 1939
- of magnetic fields on sun and bright stars (Zeeman effect)
- and especially the determination of stellar temperatures and spectral classes (see also Hertzsprung-Russell diagram and stellar evolution).
The associated measuring instruments ("spectral apparatus") of astrospectroscopy are:
- the spectroscope and the spectrometer (both visual)
- the spectrograph (photographic or with sensors)
- the monochromator and the interference spectrometer
- the frequency comb

Questions and answers
Q: What is spectroscopy?
A: Spectroscopy is the study of light as a function of length of the wave that has been emitted, reflected or shone through a solid, liquid, or gas.
Q: Why do chemists heat a chemical during spectroscopy?
A: Each chemical glows differently when heated, and spectroscopy analyses the glow of the chemical to determine its wavelength color spectrum which differs from others.
Q: How does spectroscopy differentiate between different chemicals?
A: Spectroscopy separates and measures the brightness of the different wavelengths of the glow of chemicals.
Q: What can spectroscopy determine in addition to identifying chemicals?
A: Spectroscopy can determine how hot the thing being analyzed is.
Q: What is the benefit of spectroscopy?
A: Spectroscopy allows scientists to investigate and explore things that are too small to be seen through a microscope, such as molecules and subatomic particles.
Q: What is required to measure and analyze light waves in spectroscopy?
A: Special instruments are required to measure and analyze light waves in spectroscopy.
Q: What are some examples of subatomic particles that can be investigated through spectroscopy?
A: Subatomic particles such as protons, neutrons, and electrons can be investigated through spectroscopy.
Related articles
Author
AlegsaOnline.com Spectroscopy: study of matter via interaction with electromagnetic radiation Leandro Alegsa
URL: https://en.alegsaonline.com/art/92585