Center of Population: Definition, Methods, History and Uses
Explanation of the center of population concept, measurement methods, historical examples (including the U.S.), and practical uses and limitations for planning and representation.
Overview
The center of population is a statistical point that summarizes how people are distributed across a territory. It is used in the broader study of human settlement and demographics. By reducing a complex population map to a single location, analysts can compare shifts over time and between jurisdictions, from a city neighborhood to a nation.
Image gallery
3 Images

How it is measured
There is no single way to define a center. Different methods answer different questions:
- Mean (balance) center: treats every resident as an equal weight and computes the geographic centroid, like the balance point of a flat map.
- Median center: uses median coordinates and minimizes distances in one dimension at a time.
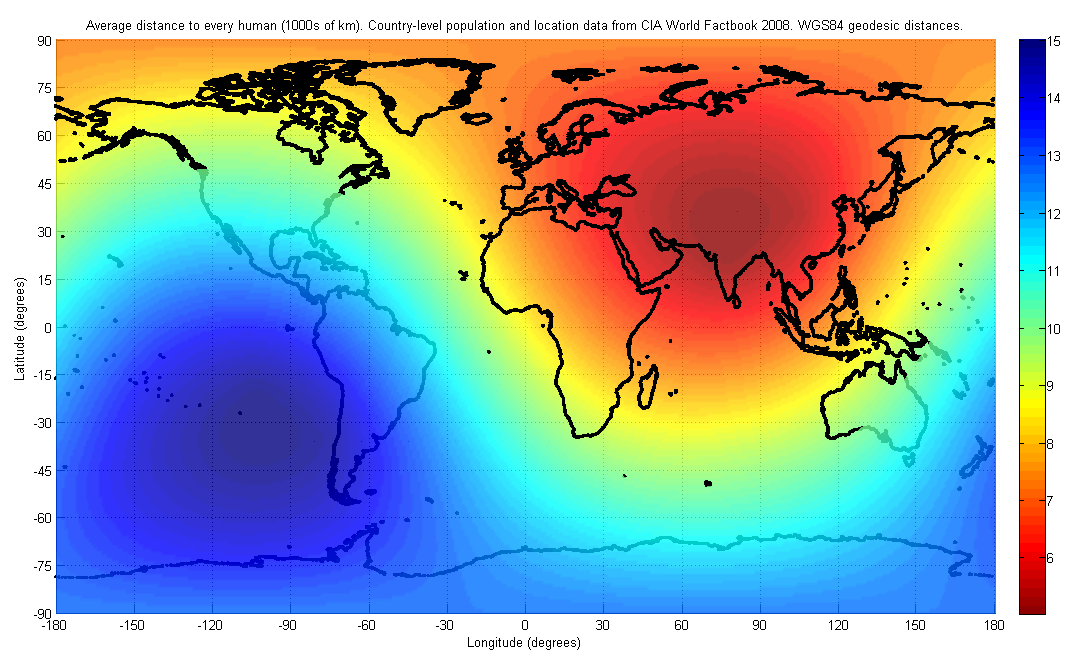
- Geometric median: finds the point minimizing the sum of distances to all residents and can differ from the arithmetic mean.
These approaches can be applied to any state or region, with choices depending on whether the aim is simple description, minimizing travel distance, or another policy objective.
History and notable examples
National statistical offices often compute a center of population at regular intervals. In the United States, the mean center has been tracked each decade alongside the U.S. Census since 1790, showing a long-term drift of population toward the west and, more recently, to the south. In recent decades the U.S. center has been located in parts of southern Missouri, illustrating broad internal shifts in where people live (southern Missouri).
Smaller-scale examples make the concept concrete: the center of population for Bangladesh lies close to Dhaka, reflecting high urban concentration. Within U.S. states, centers can be unexpectedly distant from the largest city—Ohio's center is roughly thirty miles from Columbus and is often referenced in state reports (Ohio).
Uses and limitations
Centers of population are useful for visualizing migration, planning infrastructure, and framing political and economic analyses. They inform debates about representation and service delivery—illustrated by how far some Representatives travel between their home districts and national capitals.
However, a single point cannot capture internal diversity: it ignores age structure, density gradients, and local clusters. The chosen mathematical definition affects the result, and geographic features (coastlines, mountains) shape feasible movements in ways the raw point does not reflect. For applied work, centers are best used alongside maps, density surfaces, and other demographic indicators.
Further reading
For practitioners interested in methods and historical series, statistical agencies and academic texts describe computation details, assumptions, and applications across scales. Comparing different centers (mean vs. median vs. geometric) helps clarify what each measure reveals about human settlement patterns.
Related articles
Author
AlegsaOnline.com Center of Population: Definition, Methods, History and Uses Leandro Alegsa
URL: https://en.alegsaonline.com/art/17976