
Gantt chart
A Gantt chart is a horizontal bar chart used in project management to display task schedules, durations, dependencies and progress. It helps plan, coordinate, and communicate project timelines.
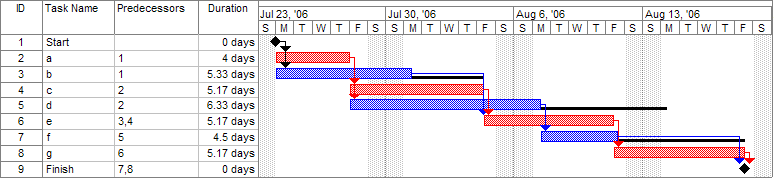
A Gantt chart is a graphical tool that represents a project schedule as horizontal bars placed along a timeline. Each bar corresponds to a task or activity and shows its planned start, duration and finish. At a glance a Gantt chart communicates which tasks run in sequence, which overlap, and how far individual tasks have progressed. Modern Gantt diagrams often include percent-complete shading, milestone symbols and a vertical marker for the current date, making it easier to compare planned and actual progress. Bar chart conventions are commonly used to draw Gantt charts.
Image gallery
2 Images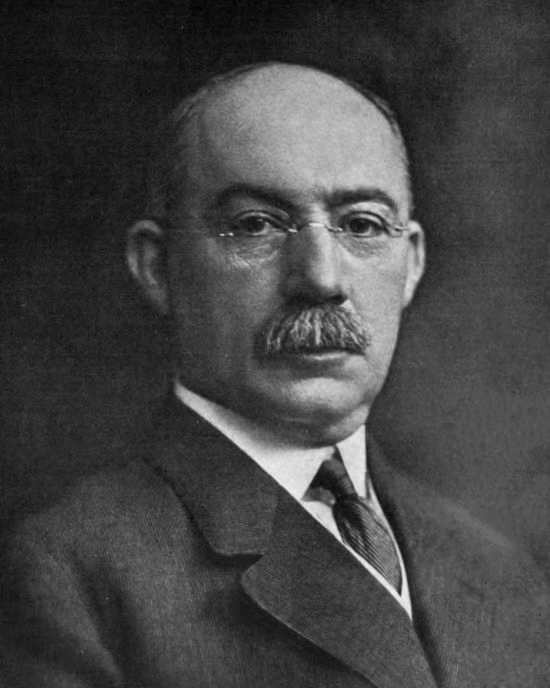
Key components and how to read one
A typical Gantt chart contains several repeated elements: a list of tasks or work packages on the vertical axis; a time scale on the horizontal axis; horizontal bars whose lengths represent durations; and connectors or arrows that show dependencies. Additional annotations may show resources assigned to tasks, start and finish dates, baselines for planned schedules, and percentage-complete indicators. Interpreting a chart requires reading each bar’s start and end points against the time scale, noting which tasks are predecessors or successors, and spotting critical tasks whose delay would affect the overall completion date.
Origins and historical development
Gantt charts are named after Henry L. Gantt, an American mechanical engineer and management consultant who developed the technique in the early 20th century. His charts built on earlier ideas for visual scheduling but were influential because they translated schedules into a simple, practical diagram that managers could use daily. Over decades the basic concept was extended and adapted: from hand-drawn charts on paper to printed project plans, and later to interactive digital tools that update bars automatically as tasks change.
Uses, examples and importance
Project managers, construction planners, software teams and event coordinators commonly use Gantt charts to plan and monitor work. A Gantt view helps answer practical questions: which tasks can proceed in parallel, which must wait for others to finish, whether resources are overbooked, and whether the project is on track. Examples include construction schedules that sequence site work and inspections, product development timelines that stage design and testing, and IT implementations that coordinate teams and deployments. The format is widely used across industries, including project management and information technology, because it combines simplicity with actionable detail.
Strengths, limitations and related concepts
Gantt charts are valuable for visualizing timing and dependencies but have limits. For very large projects with thousands of tasks they can become cluttered and hard to maintain. They also show schedule relationships but do not by themselves calculate the critical path or resource leveling — these typically require additional analysis or software features. To address such needs, Gantt charts are often paired with critical path analysis, resource histograms and work breakdown structures. For a concise project schedule view, the Gantt remains one of the most accessible and widely taught planning tools.
Practical tips and further reading
- Keep task names short and hierarchical: group related tasks into phases or work packages to reduce clutter.
- Use dependency lines sparingly and prefer milestones to summarize progress.
- Maintain a baseline copy to compare planned versus actual dates as the project proceeds.
- Many software tools provide interactive Gantt features; search resources and tutorials for templates and examples using your chosen tool.
For concise definitions and diagram examples see introductory resources such as a basic Henry L. Gantt biography, general discussions of a project schedule, and material on managing project elements. Other overviews and tutorials use interactive examples to show how percent-complete shading and the "today" marker help track actual status against plan. For more technical or software-focused guidance look for current references at reputable project management sites and training providers. Bar chart conventions and visual practices remain central to producing clear, usable Gantt diagrams.
Related articles
Author
AlegsaOnline.com Gantt chart Leandro Alegsa
URL: https://en.alegsaonline.com/art/37497
Sources
- www-public.it-sudparis.eu : "Gantt charts: a centenary appreciation"
- doi.org : 10.1016/S0377-2217(02)00769-5