Bar chart (bar graph)
Bar chart: a visual method that uses rectangular bars to compare values across categories. Covers types, components, history, uses, best practices, and distinctions from histograms and other charts.
Overview
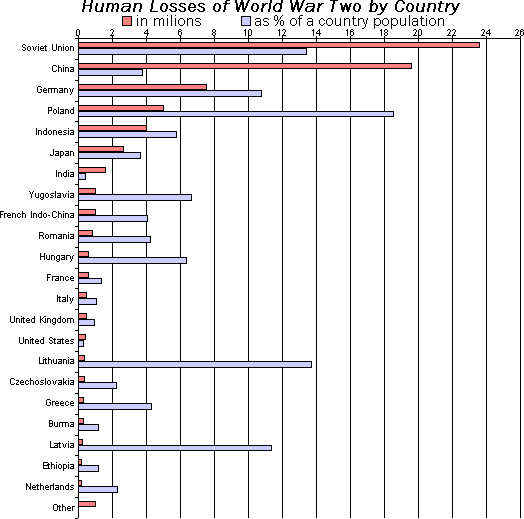
A bar chart is a graphical display in which rectangular bars represent different categories and their associated values. The length or height of each bar is proportional to the quantity it represents, making bar charts useful for comparing discrete or categorical data at a glance. Bars may be shown vertically (columns) or horizontally, and they are typically aligned along a common axis.
Image gallery
4 Images


Components and characteristics
Key parts of a bar chart include an axis with a scale, category labels, the bars themselves, and often a legend when multiple series are present. Bars should be drawn so that length—not area or volume—conveys quantity, and consistent baseline alignment (usually zero) helps avoid misleading interpretations. Colors, spacing, and ordering of bars affect readability and emphasis.
Common types
- Grouped (clustered) bars: compare multiple series side by side for each category.
- Stacked bars: show subcomponents that add up to a total for each category.
- Normalized (percent) stacked: display composition percentages rather than absolute totals.
- Horizontal bars: useful when category names are long or many categories exist.
History and provenance
Bar charts are often credited to late 18th-century graphic pioneers; William Playfair produced early forms of categorical bar diagrams in his statistical works. Since then the format has become a standard tool in print and digital reporting, evolving into interactive forms with mouseover details and dynamic sorting.
Uses and examples
Bar charts are widely used in business, science, journalism, and education to show sales by product, population by region, survey responses by option, or annual counts across years. They are effective when categories are distinct and comparisons between items are more important than distribution within a continuous range.
Distinctions, best practices and pitfalls
A histogram resembles a bar chart but is meant for continuous numerical data binned into intervals; use a histogram to view distribution and a bar chart for categorical comparisons. Avoid 3D effects, unequal baselines, and encoding values by area rather than length. For more on presentation choices and conventions see bar properties and visual encoding. Practical guidance and examples are available from many graphics guides and software documentation on data visualization.
Related articles
Author
AlegsaOnline.com Bar chart (bar graph) Leandro Alegsa
URL: https://en.alegsaonline.com/art/8830