
Topographic map
A detailed map showing the shape of the land and its features using contour lines, symbols and scales. Used for planning, navigation, engineering and environmental study, now available in digital form.
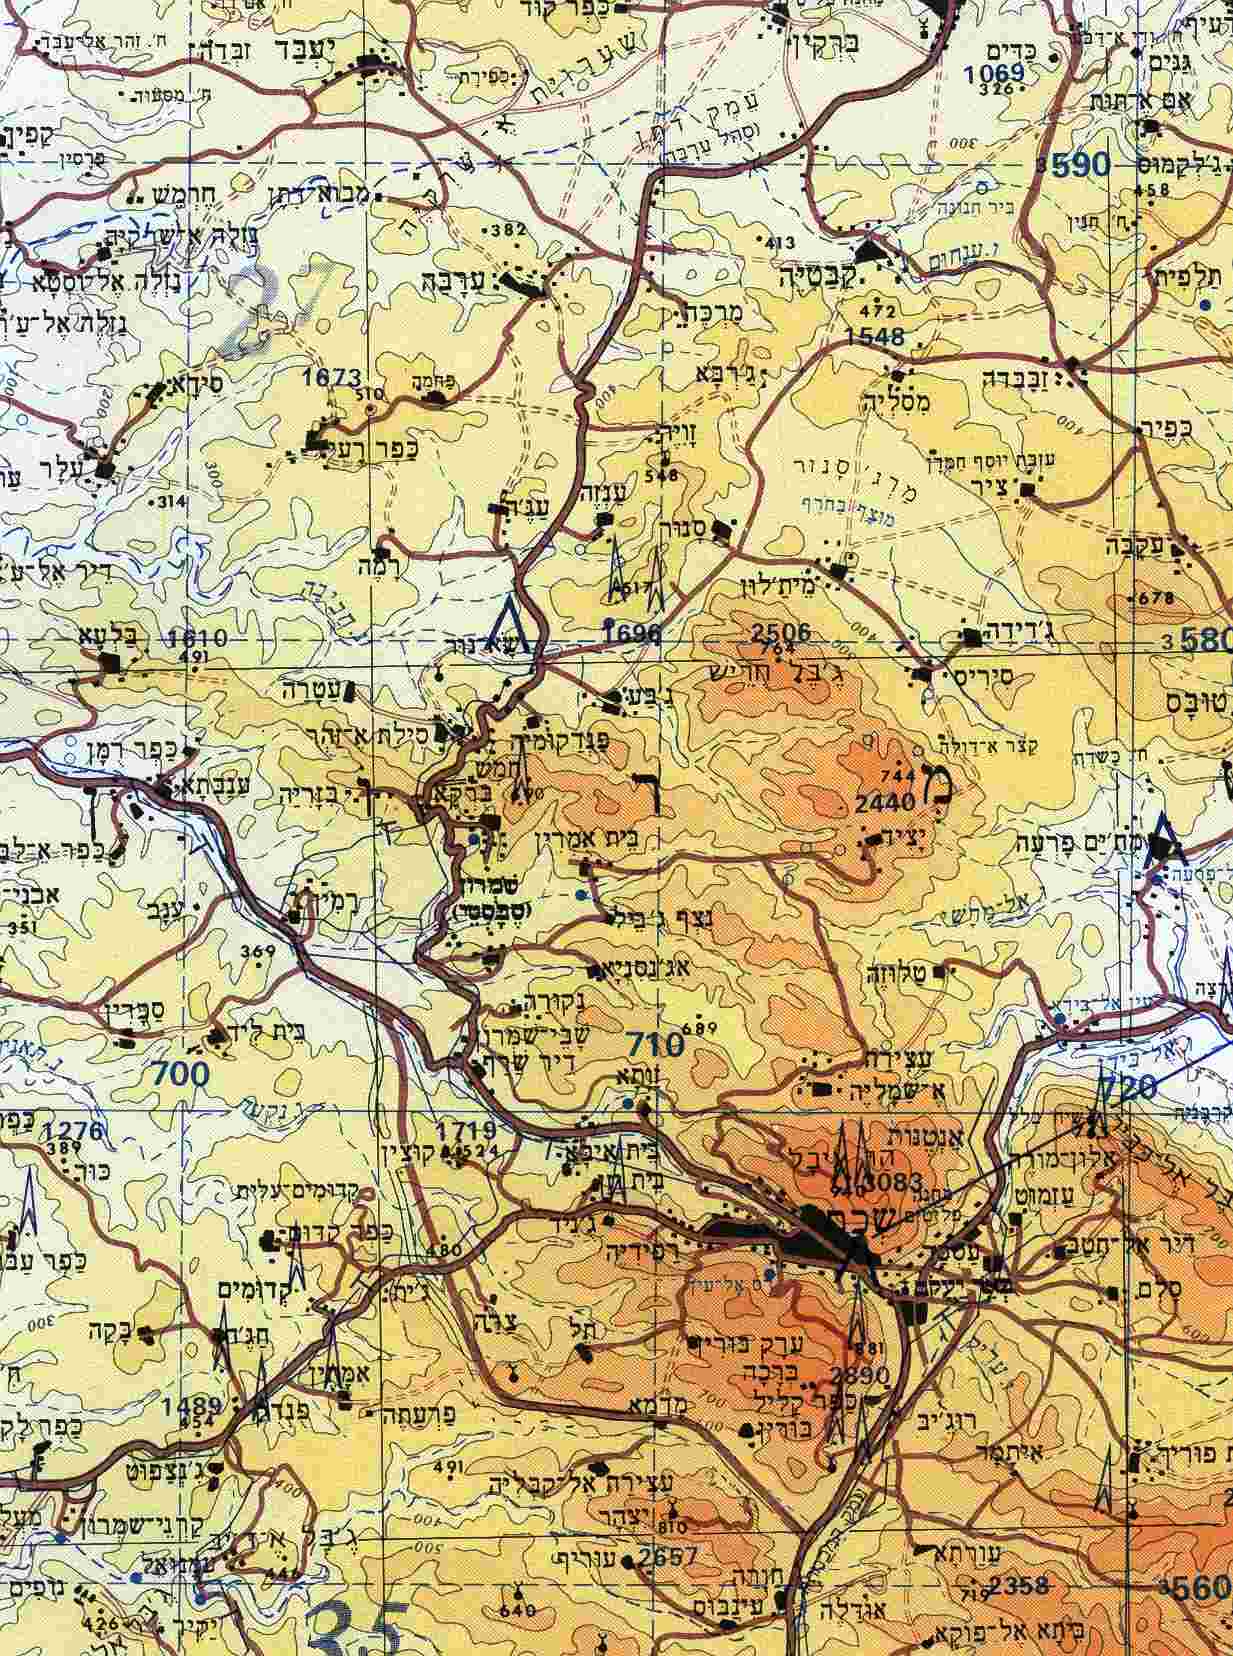
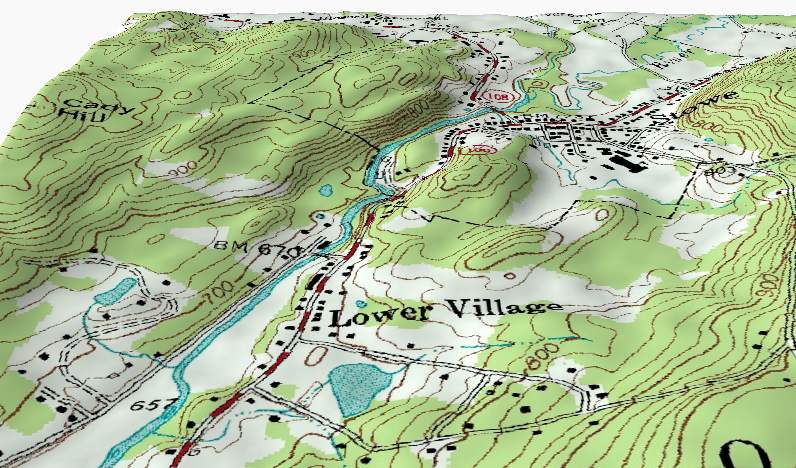
A topographic map is a specialized map that represents the three-dimensional shape of the land on a two-dimensional surface. It emphasizes relief and terrain by using contour lines, symbols and color to indicate slope, elevation and natural or human-made features. Modern topographic maps can be printed or delivered as digital layers for use in geographic information systems. For a general reference to mapping concepts see topographic map and for the broader idea of terrain see topography.
Image gallery
6 Images


Characteristics and main elements
Topographic maps combine several standard elements to describe a place precisely. A typical sheet shows contour lines that join points of equal height, spot elevations, index contours, symbols for vegetation and land use, watercourses, transportation networks and administrative boundaries. Cartographers also add a coordinate grid, north arrow and legend so users can interpret the signs and orientation. The relationship between map distance and ground distance is set by the map scale, which affects the level of detail portrayed.
Components often found on a topo
- Contour lines: lines that indicate height above a datum and the steepness of slopes — see contour line.
- Index contours and intervals: thicker lines and a regular vertical spacing that make reading elevations easier.
- Symbols and colors: standard icons for roads, buildings, vegetation and water, plus color tints for elevation bands.
- Grid and projection: coordinate ticks or ticks for latitude/longitude or national grid systems.
History and production
The production of topographic maps grew from early surveying and military needs. Techniques advanced from field triangulation and plane-table surveys to photogrammetry and aerial imagery in the 20th century. Today, cartographers use satellite data, digital elevation models and computer-assisted generalization to create and update maps. Much of the foundational work depends on systematic surveying and remote sensing to ensure positional and elevation accuracy.
Uses and reading tips
Topographic maps are used for outdoor navigation, land-use planning, engineering design, resource management and hazard assessment. Hikers use contours to estimate slope and difficulty; engineers consult profiles to design roads or pipelines; hydrologists derive watershed boundaries from the ridges and depressions. To read a map effectively, note the contour interval, look for index contours and spot heights, and examine the spacing of lines to judge steepness and relief. Elevation cues and symbols combine to give a quick sense of terrain: for example, closely spaced contours indicate steep ground while widely spaced contours suggest gentle slopes or plains — relevant when interpreting elevation.
Distinctions worth noting: a topographic map differs from a thematic map by focusing on landform and fixed features rather than a single data theme. National mapping agencies commonly revise topographic sheets on a regular schedule, and many now provide downloadable digital products and web services to integrate with modern GIS workflows. For introductory resources see the general mapping entry at topographic map or technical references on map scale and topography.
Related articles
Author
AlegsaOnline.com Topographic map Leandro Alegsa
URL: https://en.alegsaonline.com/art/100654