
Map scale (cartographic scale)
Explanation of map scale: how map distances relate to ground distances, common notations (ratio, verbal, graphical), large vs small scale, practical effects on detail and extent, and useful cautions.
Overview
Map scale expresses the relationship between distances on a map and the corresponding distances on the ground. It tells the reader how much a real-world feature has been reduced to fit the map. A clear statement of scale allows measurement, comparison and interpretation of spatial information. Cartographers provide scale in several forms so that users with different needs and tools can understand it.
Image gallery
3 Images
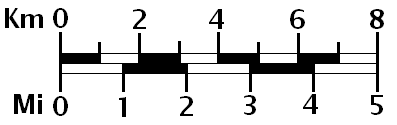

Common forms of scale
There are three widely used ways to show scale. Each has advantages in different situations:
- Representative fraction (ratio) — written as 1:n (for example 1:50,000). This is unitless: one unit on the map equals n of the same units on the ground. This form is compact and precise. Use the ratio when exact scaling is needed.
- Graphical scale (scale bar) — a drawn bar that shows ground distance corresponding to a length on the map. It remains useful when a map is reduced or enlarged in reproduction. See an example of a scale bar.
- Verbal scale — a text statement such as "one centimeter equals one kilometer". This is easy to read but depends on the units used and can be ambiguous if map reproduction changes size.
Large scale vs small scale
Maps are commonly described as large scale or small scale. A "large-scale" map shows a smaller geographic area with greater detail (for example 1:10,000), while a "small-scale" map covers a larger area with less detail (for example 1:1,000,000). This phrasing can be confusing because numerically a large-scale map has a smaller denominator in its ratio. For instance, an island displayed on a 1:10,000 map will appear larger and more detailed than the same island on a 1:25,000 map — see the example island in context here.
Practical implications for map use
Scale affects many aspects of a map's design and its suitability for particular tasks. Large-scale maps are used for city planning, cadastral records, engineering and detailed fieldwork because they show buildings, parcel boundaries and fine topography. Small-scale maps are used for regional planning, national atlases and global overviews where the goal is to show relationships over wide areas.
Because of scale-related generalization, small-scale maps omit or simplify many features that appear on large-scale maps. Distance measurements from a map are only approximate on projected, curved surfaces; the graphical scale may remain accurate in local regions but distortions increase with map extent and depending on projection. When measuring with a ruler, the representative fraction or scale bar should guide conversion to ground units.
History, conventions and notable facts
Cartographers have used scales since printed maps became common in the 16th century; the representative fraction grew in popularity as a concise technical notation. Modern digital mapping adds complexity because scale can vary across the screen (for example, when zooming), so many web maps show a dynamic scale bar that updates with zoom. Standard practical classifications often regard maps with ratios of about 1:50,000 and larger as large-scale, 1:50,000 to about 1:250,000 as intermediate, and smaller ratios as small-scale, though exact thresholds vary by discipline.
Tips for users
- Check which form of scale is provided — use a scale bar when a map image may be resized.
- Remember that a large-scale map provides more local detail but covers less area.
- Be cautious when converting distances on maps with projections that distort length; consult projection notes if precise ground distances are critical.
Related articles
Author
AlegsaOnline.com Map scale (cartographic scale) Leandro Alegsa
URL: https://en.alegsaonline.com/art/87746
Sources
- britannica.com : "map (cartography) :: Map scales and classifications -- Britannica Online Encyclopedia"
- thoughtco.com : "3 Ways of Showing a Map's Scale"