
Histogram: definition, structure, history and practical use
A histogram is a bar-based chart that summarizes the distribution of numerical data by grouping values into bins. This article explains its parts, history, uses, and differences from bar charts.
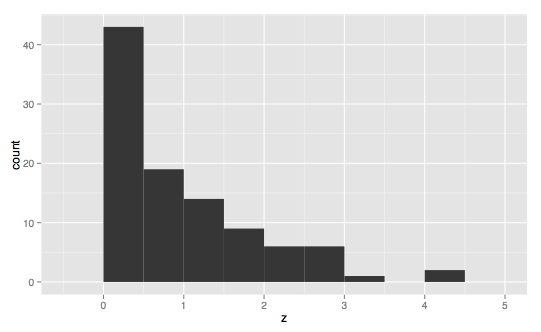
A histogram is a common method in statistical visualization for summarizing how values are distributed across a dataset. In its usual form it displays adjacent bars whose heights represent the number (or proportion) of observations that fall into consecutive intervals, often called bins. Histograms are fundamental in statistics and data analysis because they make features such as central tendency, spread, skewness and modality visually apparent.
Image gallery
10 Images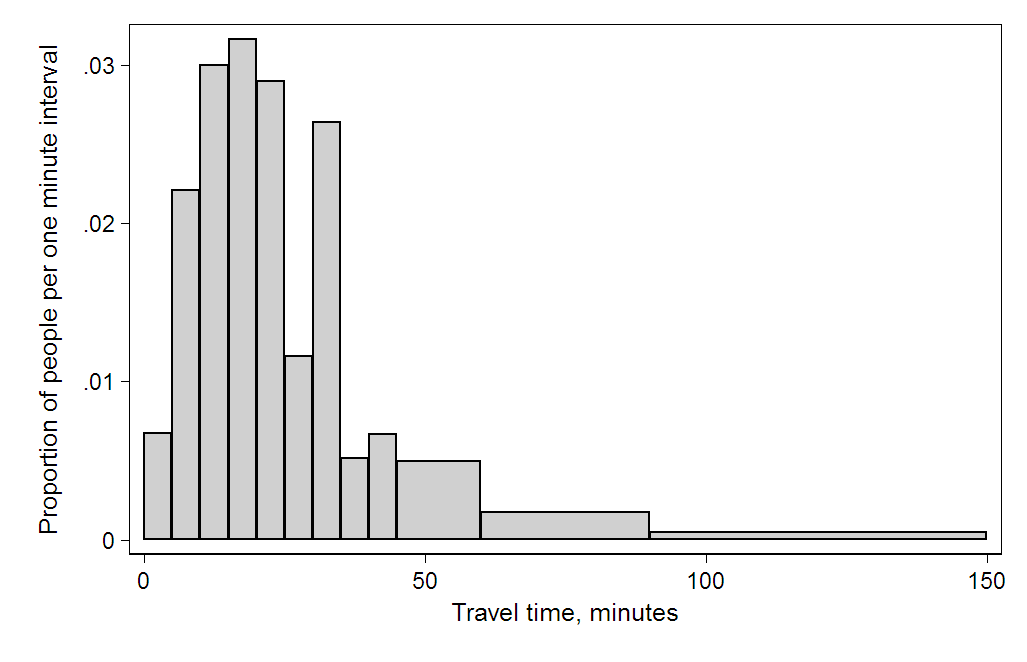



Structure and key elements
Core components of a histogram include the bins (intervals), the counts or frequencies for each bin, and the scale on the vertical axis. Bin width and bin boundaries determine resolution: narrow bins show fine detail but more sampling noise, while wide bins produce a smoother but coarser summary. A histogram represents a numerical distribution rather than discrete named categories; it may be drawn using raw counts, relative frequencies, or a density so that the total area sums to one.
Origins and terminology
The term comes from Greek roots: histos (web, mast) and gramma (drawing or record). Modern usage developed as statisticians adopted graphical summaries in the 19th and early 20th centuries. Histograms can be constructed from a simple frequency table of measurements or generated directly from raw observations.
Common uses and examples
Histograms are widely used in exploratory data analysis to inspect distributions of measurements such as heights, test scores, or rainfall. Typical tasks include:
- Identifying skewness, peaks (modes), and multi-modality.
- Detecting outliers or gaps in the data.
- Comparing shape across groups, sometimes with side-by-side or stacked histograms.
They are often the first visual step before fitting models or choosing transformations, and they complement summary statistics and other plots such as boxplots or density estimates.
Distinctions and practical notes
Histograms differ from bar charts: bar charts compare separate categorical values and leave gaps between bars, while histogram bars touch to indicate continuous intervals. Practical choices—especially bin width and alignment—strongly affect appearance; common heuristics for selecting bin size include rules like Sturges' or Freedman–Diaconis'. Alternatives and extensions include cumulative histograms, frequency polygons, and kernel density estimates. For further technical detail see a general graphical display reference and practical guides to statistical visualization and data summarization.
When preparing a histogram, label axes clearly, report whether counts or densities are shown, and consider multiple bin choices to ensure interpretations are robust. For methods and deeper context consult standard texts and tutorials in statistics and data analysis.
Questions and answers
Q: What is a histogram?
A: A histogram is a graphical display that tells us about the distribution of the samples involved.
Q: What is the purpose of a histogram?
A: The purpose of a histogram is to show the distribution of the samples involved.
Q: What does the word histogram mean?
A: The word histogram is derived from histos and gramma in Greek. Histos means web or mast. Gramma means drawing, record or writing.
Q: What does the term "histos" mean in Greek?
A: The term "histos" means web or mast in Greek.
Q: What does the term "gramma" mean in Greek?
A: The term "gramma" means drawing, record or writing in Greek.
Q: What is a common feature of a histogram?
A: A common feature of a histogram is a picture made from a table with many categories.
Q: What information does a histogram table provide?
A: A histogram table provides information about how many samples there are in each category.
Related articles
Author
AlegsaOnline.com Histogram: definition, structure, history and practical use Leandro Alegsa
URL: https://en.alegsaonline.com/art/44433