Graph (mathematics): structures, types, and applications
An accessible overview of mathematical graphs: definitions, main types (directed, undirected, simple, multigraph), basic properties, historical context, and common applications across science and technology.
Overview
A graph in mathematics is an abstract object used to model pairwise relationships between items. It consists of a set of vertices (also called nodes) and a set of edges that join pairs of vertices. The formal study of these structures is known as graph theory. Graphs provide a concise way to represent networks of many kinds — from social ties and road maps to molecular bonds and data structures in computing.
Image gallery
2 Images

Basic components and terminology
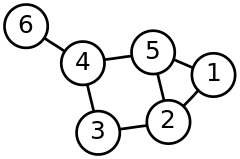
Vertices are the fundamental elements of a graph; edges are the connections. Two vertices joined by an edge are adjacent. The degree of a vertex is the number of incident edges (in directed graphs one distinguishes in-degree and out-degree). The number of vertices is often called the order of a graph and the number of edges its size. A path is a sequence of edges that connects a sequence of distinct vertices; if a path begins and ends at the same vertex it is a cycle. Connectivity, components, and distances between vertices are among the elementary properties used to describe graphs.
Common types and variants
Graphs come in several standard forms, each adapted to particular uses. Important distinctions include:
- Undirected vs directed: undirected edges have no orientation; directed edges (arcs) point from one vertex to another.
- Simple graphs vs multigraphs: a simple graph has at most one edge between any pair of vertices and typically no loops; a multigraph may contain multiple parallel edges and sometimes loops (edges connecting a vertex to itself).
- Weighted graphs: edges carry numerical weights representing cost, length, capacity, or strength.
- Special classes: complete graphs (every pair of vertices is joined by an edge), bipartite graphs (vertices split into two sets with edges only between sets), trees (connected acyclic graphs), and planar graphs (drawable without edge crossings).
History and development
The origins of graph-based reasoning are usually traced to the 18th century solution of the Königsberg bridge problem by Leonhard Euler, an early instance of modeling a problem with vertices and edges. Since then the subject evolved from a collection of combinatorial puzzles into a systematic branch of mathematics and discrete science. Through the 19th and 20th centuries graph theory absorbed techniques from algebra, topology and probability and became central to theoretical and applied areas.

Applications and examples
Graphs are ubiquitous across disciplines. In computer science they represent data structures, dependencies, control flow, and state transitions; algorithms for shortest path, spanning trees, matching and network flow are foundational. In transportation and logistics graphs model roads, schedules and routing; in social sciences they capture ties, influence and communities; in chemistry graphs model molecular connectivity; in biology they map neural or protein interaction networks. Weighted and directed variants enable modeling of capacities, distances and asymmetric relations.

Properties, problems and notable facts
Many important questions in graph theory ask about existence or optimization: does a graph contain a Hamiltonian cycle or perfect matching; what is the minimum set of edges connecting all vertices (a spanning tree); how to find the cheapest route between nodes (shortest-path problems). Some problems are efficiently solvable by established algorithms; others are computationally hard. Graphs also support visual and algebraic representation: adjacency lists or matrices encode structure for computation, while illustrations make patterns of connectivity clear.

Distinctions and conventions
Authors and fields adopt different conventions: some allow loops in multigraphs, others do not; some count loop contributions twice when computing degree. Graphs may be labeled (vertices distinguished by names) or unlabeled (considered only up to isomorphism). When describing sequences of edges one often uses the term sequence to emphasize order; in algorithmic contexts a walk, trail, path and cycle each have precise meanings. Understanding these distinctions is important when translating real-world problems into graph models.

Visual examples and special cases
Common illustrative instances include small complete graphs used to show maximal connectivity, sparse trees used to represent hierarchical data, and multigraphs that emphasize parallel connections or loops. Graph drawings can highlight cycles, articulation points (vertices whose removal increases the number of components), and bridges (edges whose removal disconnects the graph), which are useful in reliability and vulnerability analysis.


Related articles
Author
AlegsaOnline.com Graph (mathematics): structures, types, and applications Leandro Alegsa
URL: https://en.alegsaonline.com/art/40341