
Spreadsheet (computer application)
An overview of spreadsheets: what they are, key parts and features, a brief history, common uses, and important limitations and distinctions.
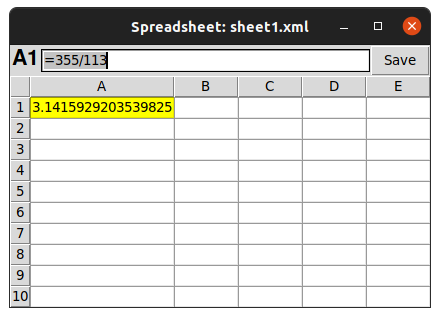
A spreadsheet is a software application that represents a two‑dimensional grid of cells, resembling a paper worksheet, and is used to record, calculate, format and display data. Each cell can contain values such as numbers, text, dates, or formulas that compute results from other cells. Modern spreadsheet programs add tools for visualization, automation and collaboration so that worksheets become interactive documents rather than static tables.
Image gallery
8 Images



Characteristics and main components
At its core a spreadsheet consists of rows and columns that form addressable cells. Common components and capabilities include:
- Cells and ranges: individual locations identified by row and column labels, and groups of cells called ranges.
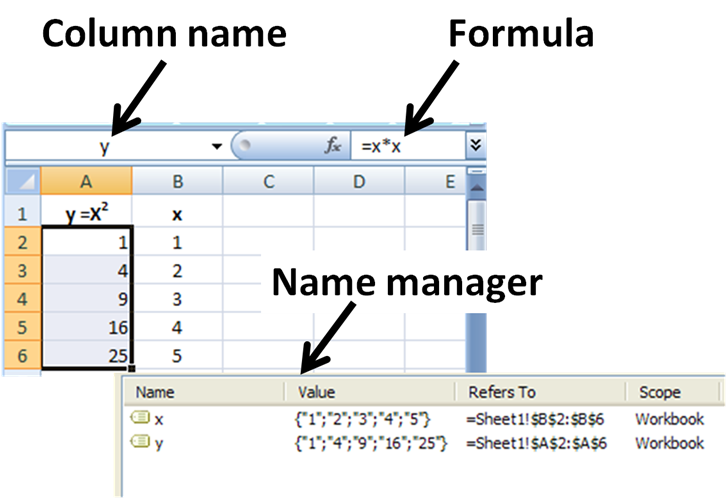
- Formulas and functions: expressions entered into cells to perform arithmetic, text manipulation, logical tests and aggregated calculations (for example SUM, AVERAGE, COUNT).
- Formatting: control over font, color, number formats, borders and conditional formatting rules to highlight values that meet criteria.
- Charts and diagrams: automatic generation of bar charts, line graphs, pie charts and other visualizations based on selected data.
- Data tools: sorting, filtering, data validation, pivot tables for summarizing large tables, and import/export functions.
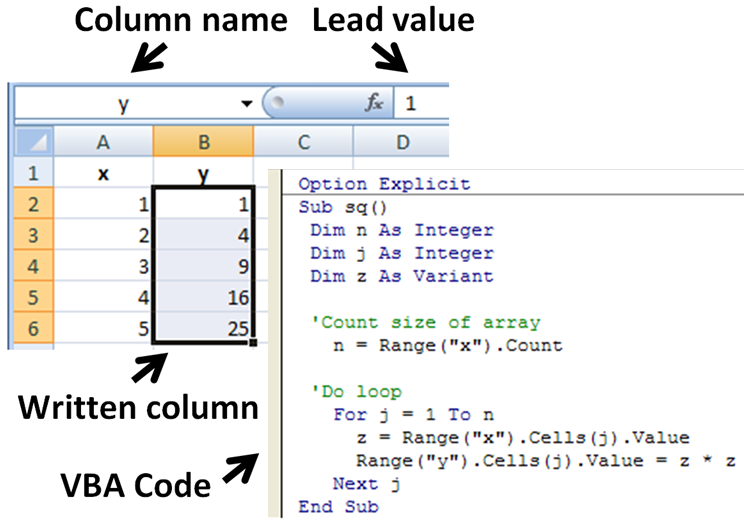
- Automation and scripting: macros or scripting environments (for example VBA in some desktop suites) that automate repetitive tasks.
History and development
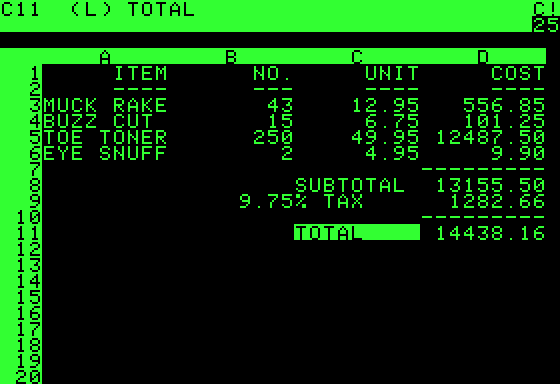
Early electronic spreadsheets appeared in the late 1970s and early 1980s. One of the first widely adopted programs translated the idea of a ledger onto a personal computer, and later products added performance, charting and macro capabilities. Over time, desktop spreadsheet packages were joined by web‑based services that emphasize real‑time collaboration and cloud storage. This evolution moved spreadsheets from single‑user analysis tools to shared instruments used across teams and organizations.
Common uses and examples
Spreadsheets are used across many disciplines because of their flexibility and immediacy. Typical uses include:
- Financial modeling, budgeting and accounting.
- Data analysis, reporting and quick ad hoc calculations.
- Scheduling, inventory lists and project tracking.
- Scientific data recording and preliminary statistical summaries.
- Creating charts and tables for presentations and reports.
Limitations, risks and distinctions
Despite their convenience, spreadsheets have notable limits. They are not a substitute for a properly designed relational database when data integrity, concurrency and complex queries are required. Large or poorly documented workbooks are prone to human error, formula mistakes and version confusion; such errors can have significant consequences in financial and operational contexts. Security concerns include macro‑based malware and inadvertent disclosure of sensitive data. Good practice includes documentation, testing, access control and using audit features where available.
For more information about available tools and features, consult materials on spreadsheet software or compare them with other office applications such as word processors. Understanding the strengths and limits of spreadsheets helps users choose the right tool for analysis, reporting and collaboration.
Related articles
Author
AlegsaOnline.com Spreadsheet (computer application) Leandro Alegsa
URL: https://en.alegsaonline.com/art/92839