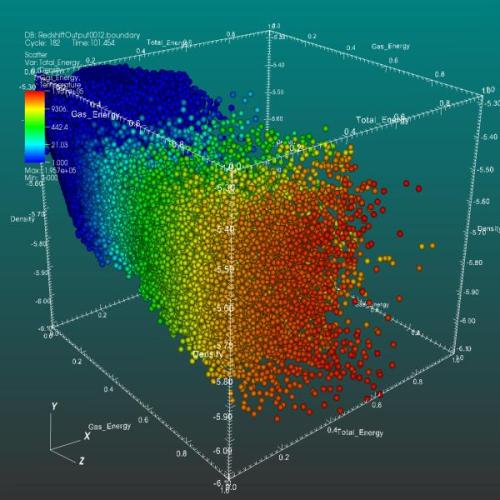
Scatter graph (scatter plot)
A scatter graph displays paired numerical data as points on two axes, revealing relationships, trends, clusters, and outliers between two variables.
A scatter graph, commonly called a scatter plot, is a two-dimensional chart that represents paired numeric observations as individual points. Each point's horizontal and vertical positions correspond to values of two variables, allowing visual inspection of patterns such as association, trend, clustering, or anomalous observations. Scatter graphs are a fundamental exploratory tool in statistics, science, engineering and data analysis.
Image gallery
3 Images

Key characteristics
Typical elements of a scatter graph include labeled horizontal (x) and vertical (y) axes, a set of plotted points, and optional guides such as a fitted trend line or confidence bands. Points may be colored or sized to encode additional categorical or quantitative information. Analysts often combine a scatter graph with a computed correlation coefficient or a regression line to summarize the direction and strength of a relationship.
Common uses and examples
Scatter graphs are used to examine whether changes in one variable correspond to changes in another. Practical examples include plotting height versus weight, temperature versus energy consumption, or advertising spend versus sales. They are useful for spotting linear and non-linear relationships, identifying clusters of similar observations, and detecting outliers that merit further investigation.
Because scatter graphs display raw data points, they help remind viewers that correlation is not causation: a visible association suggests a relationship worth studying but does not by itself prove that one variable causes the other.
Variations and related charts
- Bubble chart: a scatter plot where point size encodes a third variable.
- Jittered scatter: small random offsets applied to overlapping points to reveal density.
- Density or contour plots: used when point overlap is extreme, showing concentration regions instead of individual points.
Modern plotting tools and spreadsheets provide interactive scatter graphs with brushing, zooming and selection to explore subsets of data. For introductory guidance or examples of scatter-plot appearance and interpretation, see scatter plot resources and tutorials. Variations such as residual plots and partial regression plots extend the basic idea for diagnostic analysis in statistical modeling.
Related articles
Author
AlegsaOnline.com Scatter graph (scatter plot) Leandro Alegsa
URL: https://en.alegsaonline.com/art/87810
Sources
- wci.llnl.gov : Visualizations that have been created with VisIt