
John Venn and the Development of Venn Diagrams
Overview of John Venn (1834–1923), his invention of Venn diagrams, academic recognition, and the diagrams' role in logic, set theory, probability, statistics and computing.
Overview
John Venn (1834–1923) was an English logician and philosopher who is best known for creating the Venn diagram, a simple graphical method for showing logical and set-theoretic relationships. His work helped make abstract logical relations visually intuitive and accessible for teaching and applied work.
Image gallery
6 Images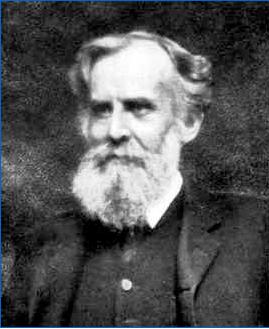


Work and main contribution
Venn introduced his diagrams in a late 19th-century paper on diagrammatic representation. The diagrams use overlapping closed curves to depict all possible logical relations between finite collections of sets or propositions. This approach extended earlier diagrammatic methods and formalized a way to represent intersections, unions, complements and exclusive regions in a single picture. Venn also wrote on probability and the interpretation of statistical evidence, connecting visual tools to quantitative reasoning.
Recognition and academic life
During his career Venn received several honors: he was elected a Fellow of the Royal Society and later awarded an Sc.D. by Cambridge. His academic standing and publications placed him among influential figures in late Victorian logic and the emerging study of probability. Philosophy, diagrammatic reasoning, and set theory were central themes in his work.
Uses and influence
- Education: elementary logic and set concepts are often taught with Venn diagrams.
- Probability and statistics: to illustrate events, overlaps and conditional relations.
- Computer science and information theory: to visualize query logic and relations.
- Reasoning and puzzles: common in competition math and informal argument analysis.
The diagrams are prized for clarity and pedagogical power; they remain a standard tool across disciplines. Venn's ideas influenced both theoretical developments and practical teaching methods, and their adaptability has led to many extensions and graphical variants.
Distinctive points and legacy
Unlike earlier Euler-style diagrams, Venn diagrams emphasize completeness by representing every possible logical region for the sets considered. Over time they have been generalized to higher numbers of sets and adapted into software visualizations. Venn's contributions bridged symbolic reasoning and visual intuition, securing a lasting place in logic, mathematics and applied sciences. Probability and statistics texts continue to use these diagrams, and modern computing examples often reference them as well: applications and historical notes are available in many introductory resources. For further reading and sources, see scholarly treatments and biographical summaries here.
Related articles
Author
AlegsaOnline.com John Venn and the Development of Venn Diagrams Leandro Alegsa
URL: https://en.alegsaonline.com/art/122687
Sources
- cis.upenn.edu : "I. On the Diagrammatic and Mechanical Representation of Propositions and Reasonings" · web.archive.org
- doi.org : 10.1080/14786448008626877
- www-history.mcs.st-andrews.ac.uk : "Venn biography"
- doi.org : 10.1093/ref:odnb/40972
- doi.org : 10.1093/ref:odnb/36639
- pictures.royalsociety.org : "Portrait of John Venn"
- doi.org : 10.1534/genetics.109.107847