Water footprint
A measure of the freshwater consumed and polluted in producing goods, services or supporting populations; broken into blue, green and grey components and used in policy, business and sustainability.
Overview
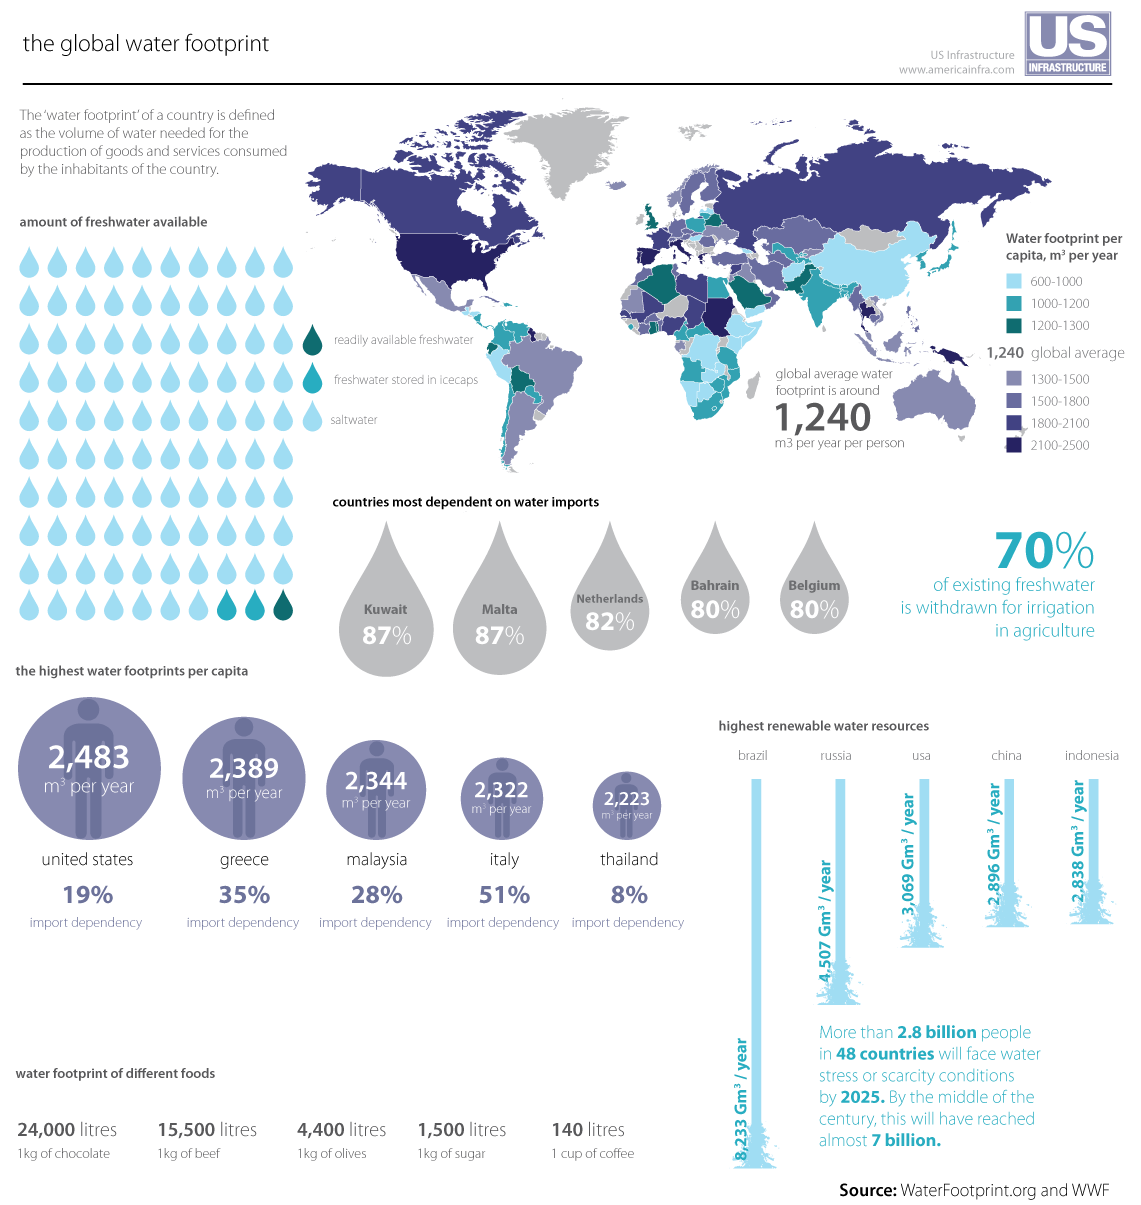
The water footprint is a metric that quantifies how much freshwater is used and degraded to produce the goods and services consumed by an individual, community, business or nation. Rather than tracking only direct water use (for example, water from a tap), the water footprint aims to account for the full supply chain: the water required to grow crops, feed livestock, manufacture products and provide services. It is often applied to single products, entire companies, cities or countries to illustrate dependencies on freshwater resources and to inform water management decisions.
Image gallery
5 Images


Components of a water footprint
Most assessments divide the footprint into three parts, each reflecting a different type of water interaction:
- Green water: rainwater stored in soil that is used by plants through evapotranspiration, important for rain-fed agriculture.
- Blue water: surface and groundwater abstracted for irrigation, industry or domestic uses; consumption means water is not immediately available for other users.
- Grey water: the volume of freshwater required to dilute pollutants from production so that water quality standards are met; it is an indicator of pollution, not a literal extra volume used.
History and development
The concept emerged in the early 21st century as researchers and policymakers sought tools to make hidden water use visible across supply chains. It builds on the earlier idea of "virtual water"—the water embedded in traded goods—and has been refined into methods and standards for calculating footprints at product, organizational and national scales. Academic groups and multi-stakeholder initiatives developed guidance to make assessments comparable and to encourage water-aware decision making.
Uses, examples and importance
Water footprints are used for several practical purposes: companies assess supply-chain risk and set stewardship strategies; governments and NGOs compare water use between sectors; consumers learn how dietary or purchasing choices influence water demand. Typical findings show that agriculture accounts for the largest share of human water consumption and that animal products generally require more water per calorie or kilogram than most crops. The metric also illuminates "virtual water trade," where water-intensive goods exported from one region effectively transfer embedded water to another.
Limitations and complementary measures
While useful, the water footprint has limitations. A single volumetric number does not reflect local water scarcity, ecological impacts, seasonal variability or the social context of water use. A company or country with a large footprint in a water-rich region may face fewer sustainability concerns than one with a smaller footprint in an arid basin. For these reasons, water footprinting is often paired with assessments of water scarcity, water stress indices, ecological flow requirements and life cycle analysis to provide more actionable insight.
Notable distinctions and practical guidance
Water footprinting differs from simple water-use accounting by including supply-chain and pollution considerations; it differs from scarcity metrics by not inherently weighting water volumes by local stress. Best practice encourages transparent boundaries (which parts of the lifecycle are included), explicit temporal and spatial scales, and combining footprint results with local water availability and governance information. As an awareness and planning tool, the water footprint helps identify hotspots for reduction, efficiency improvements and better allocation of freshwater resources.
Related articles
Author
AlegsaOnline.com Water footprint Leandro Alegsa
URL: https://en.alegsaonline.com/art/106789