Timeline: definition, structure, history and uses
A timeline arranges events in sequential order to show when they occurred. This article explains its structure, history, common layouts, uses, and practical tips for clear presentation.
Overview
A timeline is a method for listing or depicting events in the sequence in which they happened. Its purpose is to place events along a temporal axis so readers can perceive order, duration and relationships. In its simplest form a timeline presents items in chronological order, often with dates or time markers to anchor each entry.
Image gallery
3 Images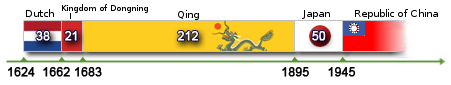

Structure and components
TImelines combine several basic elements: a time axis or scale, event markers, labels or short descriptions, and sometimes visual cues such as color, icons or images. A clear scale—linear, logarithmic or segmented—helps interpret intervals. Additional metadata, such as sources or confidence levels, improves reliability for research or reference. For many uses the long bar labelled with dates is central, providing a baseline for placing dates and events along the continuum.
History and development
Presenting events along a line has long been part of historical writing and record keeping. Graphic treatments of time expanded in the 18th–20th centuries as publishers, educators and scientists sought compact ways to show sequences and causal links. During the early 20th century project management adopted related visual schedules like the Gantt chart, which represent tasks and durations in a timeline-like graphic. The rise of computers and the web enabled interactive, zoomable timelines that can layer multimedia and large datasets.
Common types and layouts
- Linear horizontal: the classic bar or line with events placed left to right.
- Vertical: events stacked top to bottom—useful for narrow spaces or scrolling screens.
- Radial or circular: time radiates from a center, often used for cyclical data.
- Comparative/multi-axis: parallel lines compare different entities or regions across the same span.
- Interactive digital timelines: allow filtering, zooming, and embedding of media; a common form of graphic timeline.
Uses, examples and importance
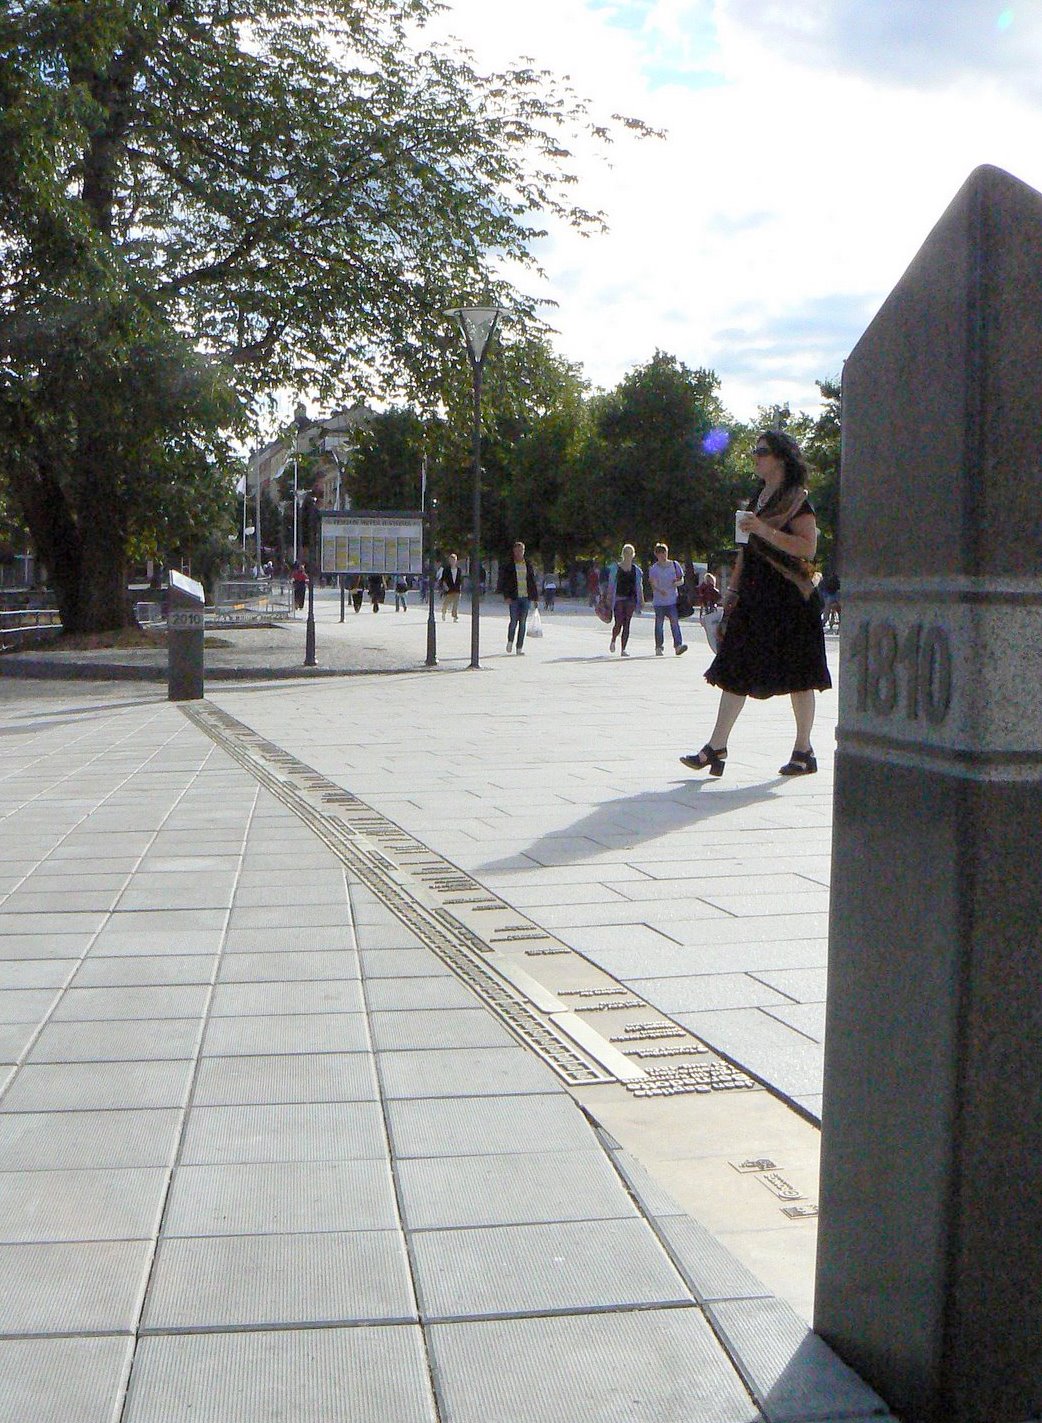
Timelines are widely used in education to teach chronology, in history and journalism to summarize sequences, in project management to schedule tasks, and in legal or medical contexts to document events. Museums and websites use timelines to orient audiences quickly. They are particularly valuable when relationships between events—causation, overlap, or progression—matter more than isolated facts.
Best practices and limitations
Effective timelines balance clarity with completeness: choose an appropriate time scale, avoid overcrowding, and include clear labels and sources. They can mislead if dates are approximate, if scale is inconsistent, or if selection biases omit important events. For complex datasets, interactive or layered timelines that allow users to filter content often communicate more than static graphics.
Further reading: introductory guides and software tutorials can show how to design timelines for print or digital media; search resources linked by topic for examples and templates.
Questions and answers
Q: What is a timeline?
A: A timeline is a way of displaying a list of events in the order they happened, called chronological order.
Q: What are some common forms of timelines?
A: Timelines can be in the form of a list or a graphic design.
Q: How is a graphic timeline typically displayed?
A: A graphic timeline typically shows a long bar labelled with dates and usually events.
Q: Can a timeline be displayed in other layouts besides a long bar?
A: Yes, a timeline can be displayed in other layouts besides a long bar.
Q: What is the purpose of a timeline?
A: The purpose of a timeline is to visually represent the order in which events occurred.
Q: What type of order do events follow on a timeline?
A: Events follow chronological order on a timeline.
Q: How can a timeline be useful in understanding history?
A: A timeline can be useful in understanding history by giving a clear portrayal of how events unfolded over time.
Related articles
Author
AlegsaOnline.com Timeline: definition, structure, history and uses Leandro Alegsa
URL: https://en.alegsaonline.com/art/99961