Star chart
A star chart is a map of the night sky showing stars, constellations and celestial objects; used across history for navigation, ritual, timekeeping and today for astronomy, education and observation.
Overview
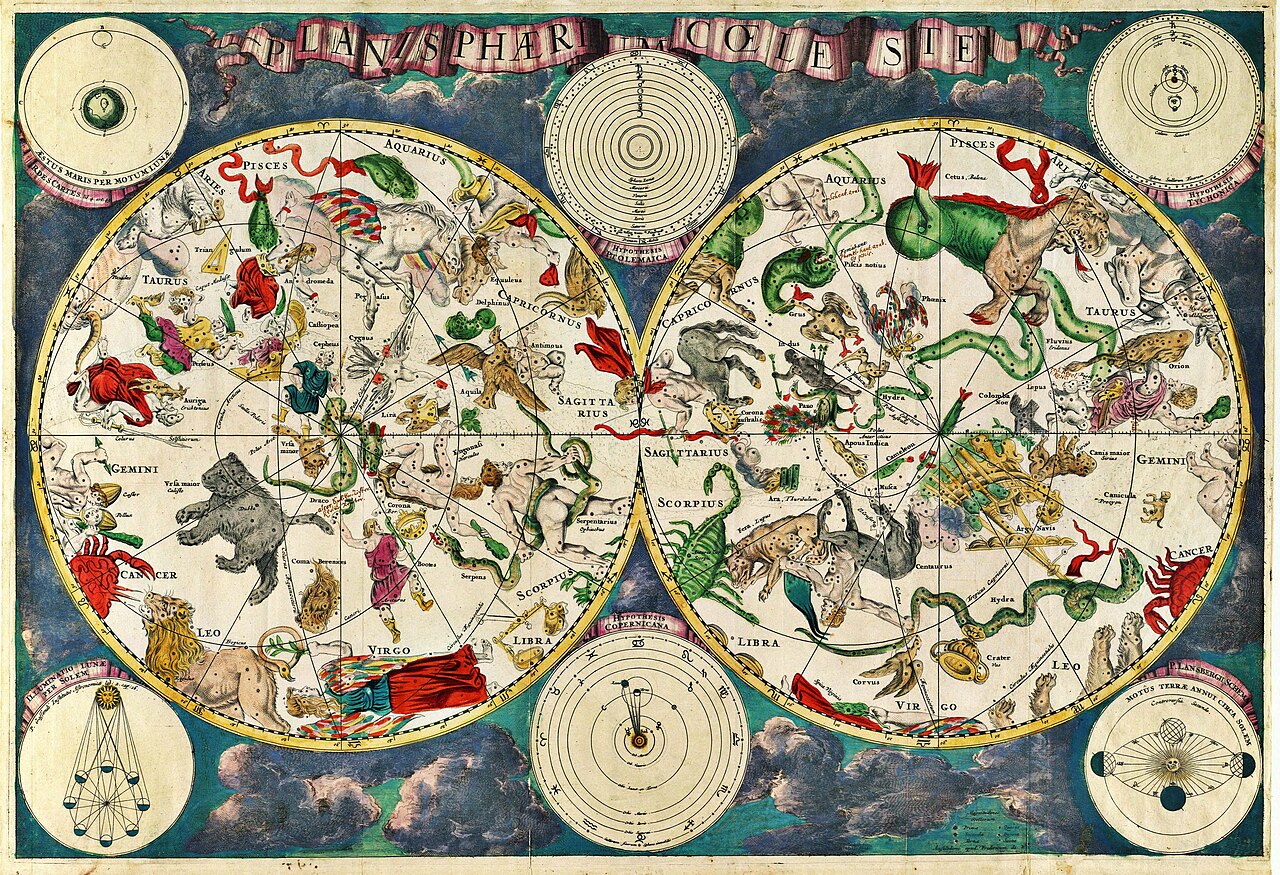
A star chart is a graphic representation of the night sky as seen from a specific place on Earth at a specified time. Charts range from simple seasonal maps for casual stargazers to detailed atlases used by experienced observers and navigators. At their simplest they are a diagram that locates stars and familiar patterns; more complex examples include coordinate grids, magnitude scales, and markers for deep-sky objects such as nebulae and galaxies.
Image gallery
9 Images


Typical components and formats
Most star charts include a mixture of elements designed to help identify and locate objects:
- Star symbols and magnitudes — symbols or dots sized to indicate apparent brightness and sometimes color.
- Constellation figures and boundaries — stylised outlines, connecting lines, or officially defined boundaries to group stars into constellations.
- Coordinate frameworks — celestial coordinates (right ascension and declination) or horizon coordinates (azimuth and altitude) to provide precise bearings.
- Projection and scale — a chosen map projection (for example stereographic or gnomonic) that represents the curved celestial sphere on a flat surface.
- Epoch and precession notes — the date or epoch to which positions are referred; long-term motions require corrections for precession.
Projections and practical formats
Different projections suit different uses. Stereographic projection preserves angles and is widely used for star charts and planispheres because it represents circles as circles. Gnomonic projection can be useful for short great-circle navigation. Practical formats include printed atlases, rotating planispheres (adjustable paper wheels for date and time), wall charts, and interactive software or mobile apps that overlay charts on the sky in real time.
How to read and use a chart
To use a chart effectively, identify the correct hemisphere and local time or set the chart's epoch, then orient the map to match the sky. Bright stars are used as reference points to find fainter objects. Many modern charts include finder charts and coordinate readouts so telescopes can be pointed accurately. Users should also account for light pollution, atmospheric extinction, and local horizon obstructions.
History
People have recorded star positions for millennia. Babylonian and Egyptian sources incorporated celestial schemata into timekeeping and ritual practice, and carved or painted depictions are known from several ancient cultures. Classical Greek astronomy compiled earlier observations; one influential work is Ptolemy's Almagest, a second-century compilation that listed over a thousand stars and served as a foundation for later chartmakers. Islamic astronomers of the medieval period produced detailed illustrated catalogues and instruments that transmitted and expanded classical knowledge into the Renaissance.
In the Renaissance the printing press enabled the wide dissemination of star maps and atlases, increasing standardisation of constellation figures and names. Charts were created for navigation, religious calendars, scholarly study, and later for scientific observation as instruments and observational methods improved.
Data, production and modern catalogues
Scientific star charts are produced from measured positions and magnitudes recorded in catalogs and digital data repositories. Historically, tables of positions appeared in manuscripts and printed books; modern charts draw on large-scale surveys and databases. Chart-makers convert tables of measurements and entries from online databases into plotted maps suitable for different scales and purposes.
Uses, distinctions and cultural roles
Star charts serve practical, educational and cultural functions. They support navigation, calendar making, and agricultural timing in traditional contexts and are central to observational astronomy and public outreach in modern contexts. Charts used in scientific work differ from those used in astrological or ritual traditions; the disciplines approach the sky with different aims and conventions. For historical context see studies of ancient inscriptions and bibliographies of Renaissance atlases. General resources and illustrative guides are available in museum collections and educational portals (astronomy, astrology).
Further reading and resources
Introductory observers often begin with a planisphere or simple pocket chart and progress to atlases or software as needs become more precise. For practical guides, catalogs and historical sources consult online and library collections that gather charts, diagram examples, and scholarly editions of older works. Where possible, cross-reference printed charts with digital tools to verify positions and current nomenclature.
For structured lists of measurements and historical entries see catalog tables and digital databases maintained by observatories and research institutions. General introductions and teaching materials are available through educational portals and planetaria that provide curated visualisations and explanatory texts (data sources, historical notes, and labelled maps).
Questions and answers
Q: What is a star chart?
A: A star chart is a graphical representation of the night sky as it appears from Earth.
Q: What is the origin of star charts?
A: Star charts are one of the oldest forms of written or carved communication.
Q: Is there any evidence of prehistoric star charts?
A: There is a claim for a prehistoric carving as the first known star chart, but the evidence is not clear.
Q: In which ancient civilizations were star charts found?
A: Star charts occur in Babylonian and Ancient Egyptian wall decorations and writing.
Q: Why were early star charts used?
A: Early star charts were used for practical reasons and for religious reasons.
Q: Are star charts still used today?
A: Even today, star charts are used for both astronomy and astrology.
Q: When were the first tables used in star charts?
A: Historically, the first tables were in Ptolemy's Almagest (~AD 150), which had the last known star table from antiquity, with 1,028 stars.
Related articles
Author
AlegsaOnline.com Star chart Leandro Alegsa
URL: https://en.alegsaonline.com/art/93424
Sources
- arxiv.org : 1211.3744
- arxiv.org : 1309.3372
- news.bbc.co.uk : news.bbc.co.uk/1/hi/sci/tech/2679675.stm