Standard deviation (measure of dispersion)
Standard deviation quantifies how spread out values are around the mean. It is the square root of variance, used in statistics, science, finance and quality control, with different formulas for populations and samples.
Standard deviation is a common summary statistic that describes the amount of variation or dispersion in a set of numerical values. Intuitively, it measures how far the typical observation lies from the central value of the distribution — usually the arithmetic mean or the theoretical expected value. A small standard deviation means values cluster closely around the centre; a large one means they are spread out more widely (close to the average vs far from it).
Image gallery
2 Images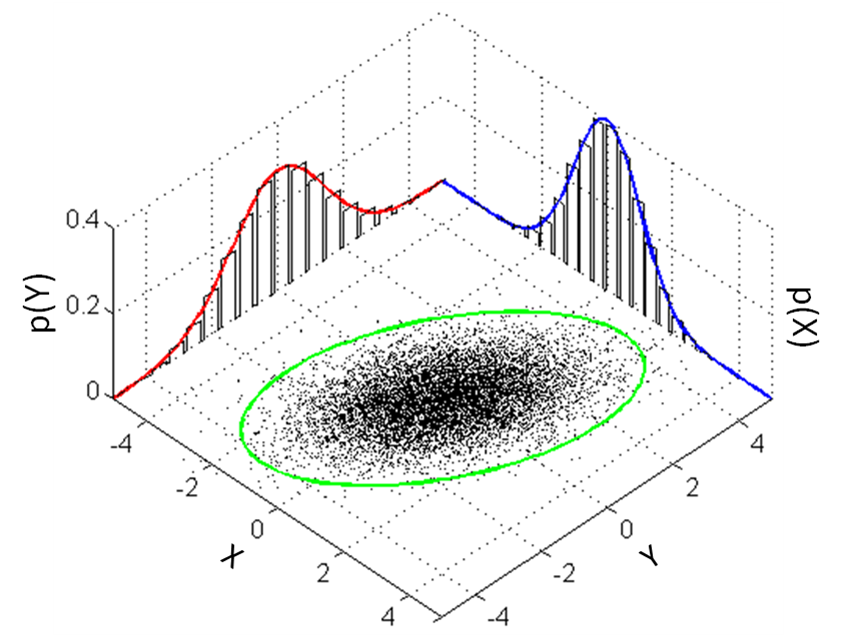
Definition and interpretation
Mathematically, the standard deviation is the square root of the variance. The variance is the average of the squared differences between each observation and the mean, so taking the square root returns a measure in the same units as the original data. Because of this, the standard deviation is often preferred when reporting variability: it conveys spread in familiar units (for example, dollars, centimeters, or test points).
How to compute it
- Compute the mean of the data set.
- For each value, calculate its deviation from the mean and square that deviation.
- Average those squared deviations (this gives the variance); then take the square root to obtain the standard deviation.
When all values in a population are available, the population standard deviation uses the divisor N. When only a sample is available, the sample standard deviation uses a slightly different formula that divides by (n−1) instead of n; this adjustment, known as Bessel's correction, gives an unbiased estimate of the population variance. The population standard deviation is conventionally denoted by the Greek letter σ (sigma) and the sample standard deviation by s.
Practical uses and examples
Standard deviation appears across science and everyday decision-making. Scientists report it to characterize experimental variability; differences larger than about two or three standard deviations are often treated as noteworthy. In finance, standard deviation is a basic measure of investment volatility: a higher value signals wider swings in returns. It also underlies many statistical tools: confidence intervals, hypothesis tests, control charts in manufacturing, and z-scores that standardize individual measurements.
Key properties and caveats
- Units: standard deviation has the same units as the data, unlike variance which is squared units.
- Normal distribution rule: for many bell-shaped (normal) distributions, roughly 68% of values lie within one standard deviation of the mean, about 95% within two, and 99.7% within three — a useful approximation, but it applies exactly only to the normal case.
- Sensitivity to outliers: because deviations are squared, large deviations have a disproportionate effect; alternative measures (median absolute deviation) are used when robustness is required.
- Relationship to the mean: standard deviation depends on the chosen center; using the mean minimizes the variance among choices of a central value.
History and notable facts
The idea of measuring spread has long roots in probability and statistics. The concrete symbol σ and the modern usage of "standard deviation" were popularized by statisticians in the late 19th and early 20th centuries as part of formalizing statistical inference. Because it links directly to the variance and to properties of the normal distribution, the standard deviation remains a cornerstone of descriptive and inferential statistics.
Further reading
For more detail on computation, interpretation and alternatives, consult introductory statistics texts or online resources that explain variance, standard error of the mean (σ/√n), and robust measures of spread. See also material on confidence intervals and the practical meaning of "two-sigma" or "three-sigma" thresholds in applied work. margin of error | mean | expected value | closeness to average | scientists | money | sigma symbol
Questions and answers
Q: What is standard deviation?
A: Standard deviation is a number used to tell how measurements for a group are spread out from the average (mean or expected value).
Q: What does a low standard deviation mean?
A: A low standard deviation means that most of the numbers are close to the average.
Q: What does a high standard deviation mean?
A: A high standard deviation means that the numbers are more spread out.
Q: How is standard deviation used in money?
A: In money, the standard deviation on interest earned shows how different one person’s interest earned might be from the average.
Q: When can only part of a group be measured?
A: Many times, only a sample, or part of a group can be measured.
Q: How is the whole group's standard deviation represented?
A: The whole group's standard deviation is represented by the Greek letter σ {\displaystyle \sigma } .
Q: How is the sample's standard deviation represented?
A: The sample'sstandard devation is represented by s {\displaystyle s} .
Related articles
Author
AlegsaOnline.com Standard deviation (measure of dispersion) Leandro Alegsa
URL: https://en.alegsaonline.com/art/93321
Sources
- edupristine.com : "What is Standard Deviation"
- jeff560.tripod.com : "Earliest known uses of some of the words of mathematics"