Spectrograph: instrument for separating and recording a wave spectrum
An overview of spectrographs: how they separate waves into spectra, main components, historical development, common types and applications in astronomy, chemistry, acoustics and remote sensing.
Overview
A spectrograph is an instrument that separates a wave into its constituent frequencies and records the resulting spectrum. Spectrographs are most often associated with light (visible, ultraviolet, infrared) but the same underlying idea applies to radio waves and sound. The recorded output — commonly called a spectrum or spectrogram — shows how intensity varies with wavelength or frequency and can reveal composition, motion, temperature and other physical properties of a source.
Image gallery
9 Images


Main parts and basic operation
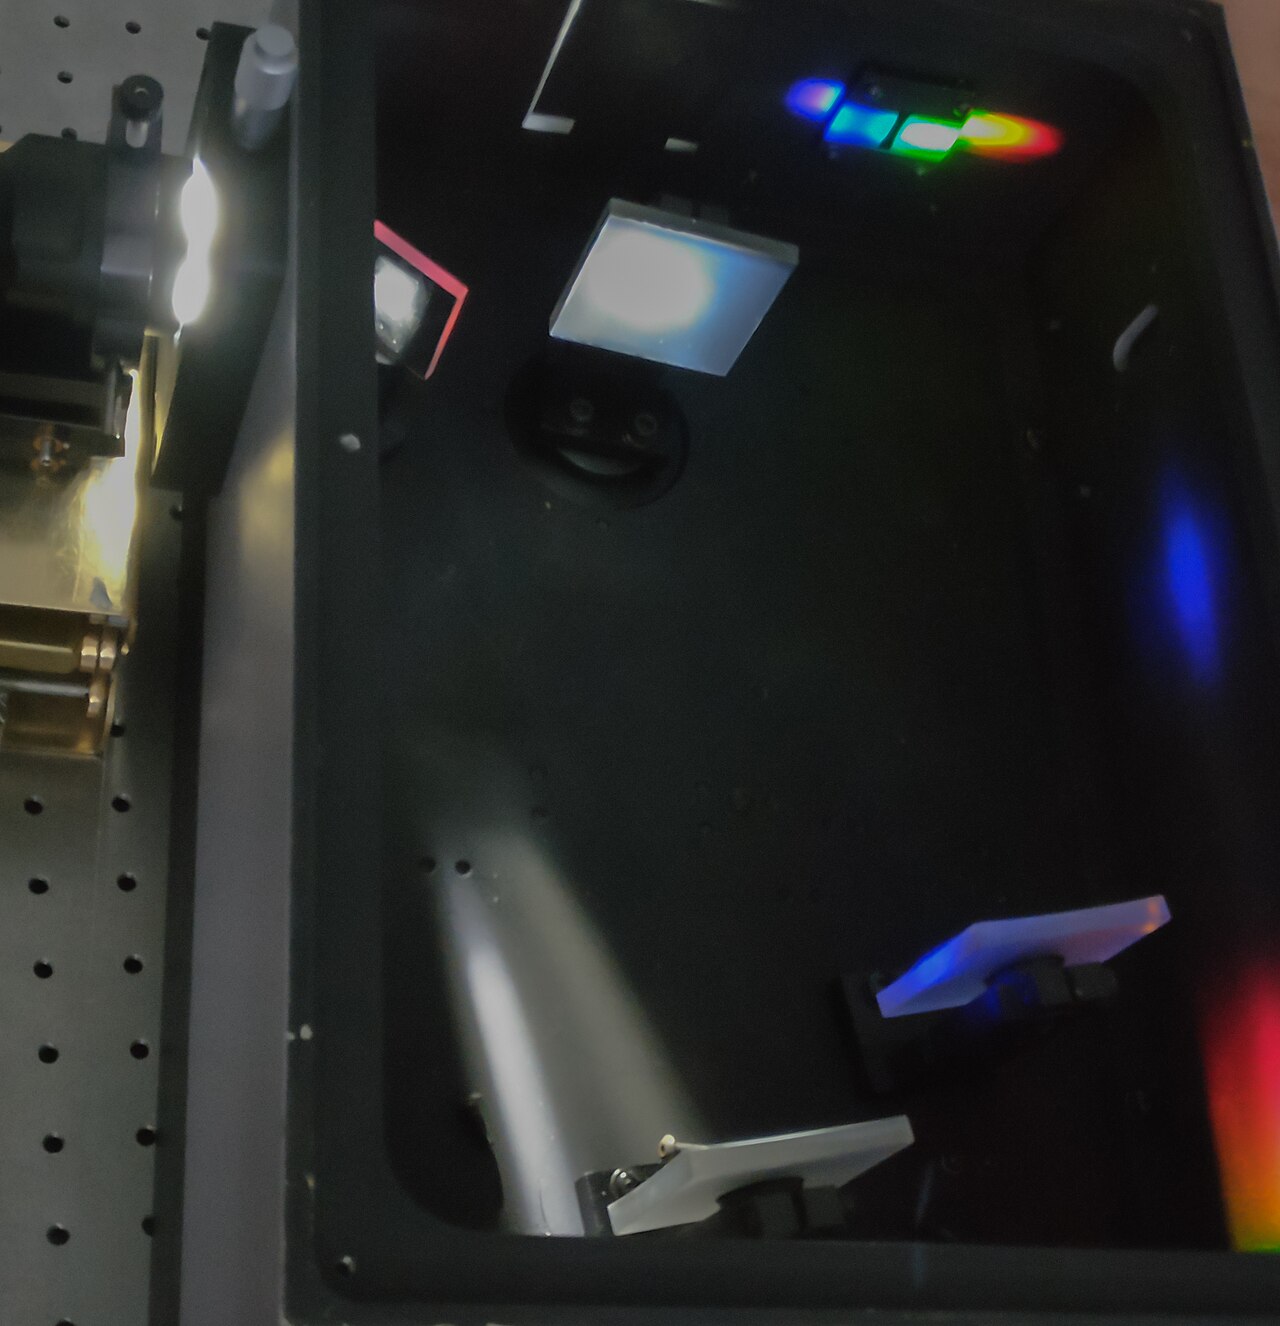
Most optical spectrographs share a common sequence of elements that take incoming radiation and form a measurable spectrum. A typical layout includes:
- Entrance aperture or slit: defines the portion of the source accepted and helps set spectral resolution.
- Collimator: converts light from the slit into a parallel beam for dispersion.
- Dispersive element: a prism or diffraction grating that separates wavelengths spatially.
- Camera or focusing optics: images the dispersed light onto a recorder.
- Detector: historically a photographic plate, now typically a CCD or other electronic sensor.
Spectral resolving power is often expressed as R = λ/Δλ, where Δλ is the smallest distinguishable wavelength difference. For non‑optical waves (audio or radio) the equivalent components perform filtering and time–frequency analysis to produce spectrograms.
History and development
The idea of analyzing light by wavelength dates to early studies of optical dispersion; the term "spectrograph" was first recorded in the late 19th century. Photographic spectrographs became essential tools in astronomy and chemistry as photographic plates allowed permanent records of spectra. In the 20th and 21st centuries, electronic detectors, diffraction gratings, fiber feeds and cross‑dispersed echelle designs have greatly increased sensitivity and resolution.
Types and notable variants
- Long‑slit spectrograph: used to record variation along an extended source such as a galaxy or nebula.
- Echelle spectrograph: a high‑resolution design that uses multiple orders and cross dispersion.
- Fiber‑fed spectrograph: commonly used in modern observatories to bring light from a telescope focus to a stable bench instrument.
- Polychromator: a related device that separates light into several discrete bands, often directing each band to a separate detector.
Uses and examples
Spectrographs are central to many scientific and practical fields. In astronomy they determine chemical composition, radial velocities (via Doppler shifts) and physical conditions of stars and galaxies. In laboratory and industrial settings they support chemical analysis, material identification and process monitoring. Acoustic spectrography and radio spectrography are used in signal analysis, speech research and telecommunications. For further technical reading see related references.
Distinctions and notable facts
Terms such as spectrograph and spectrometer are sometimes used interchangeably: broadly, a spectrograph records a spectrum (often an image), while a spectrometer emphasizes quantitative measurement and may output numerical data. Modern instruments blur this distinction because electronic detectors both record and enable direct numerical analysis. Advances in detector technology and dispersion techniques continue to expand the range of phenomena that can be investigated spectroscopically.
Questions and answers
Q: What is a spectrograph?
A: A spectrograph is an instrument that breaks up a wave into a frequency spectrum.
Q: What types of waves can a spectrograph analyze?
A: A spectrograph can analyze sound, light, or radio waves.
Q: How does a spectrograph break up a wave?
A: A spectrograph breaks up a wave into a frequency spectrum.
Q: What is the frequency spectrum of light?
A: The frequency spectrum of light is the brightness (intensity) and the amount of each color.
Q: When was the term "spectrograph" first used?
A: The term "spectrograph" was first used in 1884.
Q: What is the relationship between a spectrograph and a polychromator?
A: A spectrograph is closely related to a polychromator.
Q: How many kinds of spectrographs are there?
A: There are several kinds of machines called spectrographs, used to look at different waves.
Related articles
Author
AlegsaOnline.com Spectrograph: instrument for separating and recording a wave spectrum Leandro Alegsa
URL: https://en.alegsaonline.com/art/92582
Sources
- merriam-webster.com : Merriam-Webster Dictionary: Spectrograph