Sea surface temperature (SST)
Sea surface temperature (SST) is the temperature of the uppermost layer of the ocean. Measured by satellites, buoys and ships, SST is a key variable for weather, climate, ecosystems and oceanography.
Overview
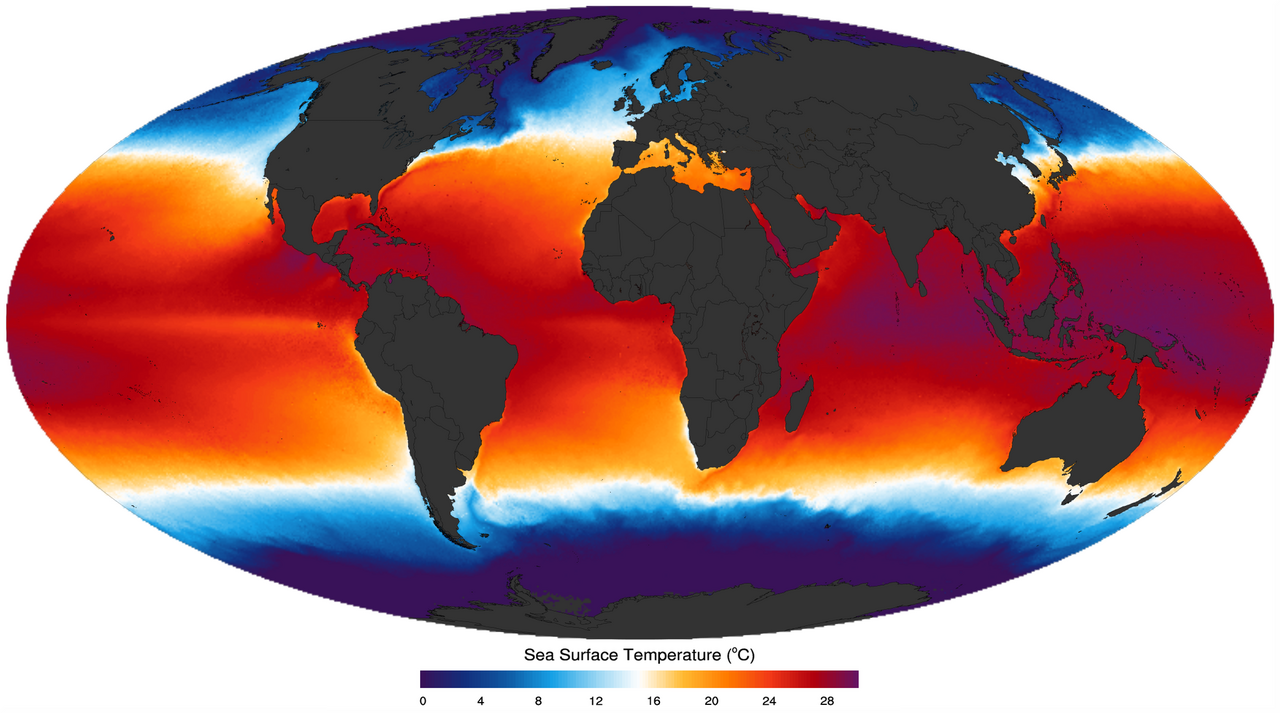
Sea surface temperature (SST) refers to the temperature of the ocean's uppermost layer and is a fundamental parameter in oceanography and climate science. In practice, “surface” can mean slightly different layers depending on how the measurement is made: satellite instruments sense a very thin skin layer, in situ thermometers record temperatures at specified depths, and ship-based readings often sample intake water a few meters below the surface. SST is commonly reported in degrees Celsius and is used to track patterns such as warm and cold water pools, fronts, and large-scale phenomena like El Niño and La Niña.
Image gallery
10 Images


How SST is measured
Measurements come from several complementary platforms. Satellite radiometers operating in the infrared sense the radiative temperature of the ocean skin — typically the top 0.01–0.001 millimetre — and provide comprehensive spatial coverage but are limited by cloud cover. Microwave satellite sensors can penetrate clouds to an extent and retrieve temperatures representing a slightly deeper layer. In situ observations from drifting buoys, moored buoys, ships, and modern profiling floats record temperatures at defined depths (for example the upper 1 m or deeper), each with their own bias and uncertainty.
- Satellite infrared: high resolution, cloud-limited; measures skin temperature (satellite SST).
- Microwave remote sensing: lower resolution, better through clouds.
- In situ buoys and ships: direct measurements at specific depths; used for calibration and validation (in situ networks).
Variability and controlling factors
SST varies across time scales from daily to decadal. Diurnal heating by the sun can warm a thin surface layer on calm, sunny days, while winds, waves and mixing pull cooler water upward and reduce surface warming. Ocean currents redistribute heat horizontally, and coastal upwelling brings cold deep water to the surface. Seasonal cycles follow changes in solar insolation at different latitudes. Human-driven climate change has affected average SSTs over recent decades, altering weather patterns and marine ecosystems.
Importance and applications
SST is crucial for weather forecasting, climate monitoring and marine resource management. Warm surface waters supply energy to tropical cyclones and affect storm intensity. Large SST anomalies are central to climate phenomena such as El Niño, which can shift rainfall and temperature patterns worldwide. Fisheries, coral reefs and plankton productivity are sensitive to SST changes: rapid warming can cause coral bleaching and ecosystem disruption. Long-term SST records are therefore a key ingredient in detecting and attributing climate trends.
History, datasets and practical considerations
Systematic SST observations began with ship logs and thermometers; global satellite mapping expanded coverage from the late twentieth century onward. Modern SST products blend satellite and in situ data, applying corrections for skin-versus-bulk differences, diurnal warming, and known instrument biases. Users should note differences between skin, subskin and bulk SST when comparing datasets, and consider temporal and spatial resolution when applying SST information to weather models, climate studies or marine management (further reading).
Key distinctions: skin SST (satellite infrared) vs. bulk SST (buoy/ship), instantaneous vs. daily-averaged values, and remotely sensed vs. in situ measurements. Understanding these distinctions helps interpret SST for scientific and operational uses.


Related articles
Author
AlegsaOnline.com Sea surface temperature (SST) Leandro Alegsa
URL: https://en.alegsaonline.com/art/88280