
Parametric statistics
Branch of statistics that models data using fixed-form probability distributions defined by a finite set of parameters; includes estimation, hypothesis testing, and common methods like t-tests and linear regression.
Parametric statistics is the area of statistical science that models observed data as coming from a specific family of probability distributions described by a finite set of numerical parameters. In practice this means analysts assume observations arise from a known distributional form (for example, the Normal family) and focus on estimating and testing the numerical parameters that define that form. For a concise introduction see parametric statistics overview.
Core assumptions and components
Key assumptions include a specified distributional family and a finite set of parameters (mean, variance, regression coefficients, etc.). The primary components are:
- the probability model or family (e.g., Normal, Binomial, Poisson),
- parameters to be estimated (location, scale, shape, regression slopes),
- observations or data points thought to follow that model (observations), and
- statistical procedures for estimation and inference.
Estimation and inference
Common estimation approaches include maximum likelihood and method of moments. Inference typically proceeds via confidence intervals and hypothesis tests built under the parametric model; familiar tools such as t-tests, analysis of variance (ANOVA), and linear regression are parametric methods. These techniques rely on the model to derive sampling distributions of estimators and test statistics.
History and development
The distinction between parametric and other approaches has long roots in statistics. The explicit label "parametric" was used early in 20th-century statistical literature; notable methodological advances came with formal likelihood theory and the development of estimators and tests. Parametric methods became central because they allow compact summaries of data through parameters and permit powerful, interpretable inference when assumptions hold.
Uses, strengths and limitations
Parametric approaches are widely used across sciences, industry and government when a plausible distributional form can be assumed: estimating population means, modeling counts or rates, fitting linear models, and designing experiments. Advantages include efficiency (good use of information), simple summaries, and well-understood theory. Limitations arise when the assumed family is a poor fit: biased estimates, misleading tests, and invalid confidence intervals. Robust alternatives or model diagnostics are recommended when assumptions are suspect.
Practical considerations and distinctions
Practical work emphasizes model checking, residual analysis, and possible transformations to better match assumptions. When the distributional form is unknown or hard to justify, nonparametric and semiparametric methods offer fewer assumptions at the cost of some power or simplicity. For technical background on distributional models see probability distribution.
Overall, parametric statistics remains a foundational framework: powerful and efficient when its assumptions are defensible, but reliant on careful model choice and diagnostic assessment.
Example
In order to test a new therapy for lowering cholesterol, the cholesterol levels of ten test persons are determined before and after treatment. The following measurement results are obtained:
| Before treatment: | 223 | 259 | 248 | 220 | 287 | 191 | 229 | 270 | 245 | 201 |
| After treatment: | 218 | 242 | 241 | 208 | 297 | 168 | 208 | 273 | 250 | 186 |
| Difference: | 5 | 17 | 7 | 12 | −10 | 23 | 21 | −3 | −5 | 15 |
If the new therapy has an effect, then the mean of the differences should be significantly different from zero. The parametric test rejects the null hypothesis, while the nonparametric test cannot. In practice, of course, one would do one-sided tests here.
Parametric method
Typically, one would use the two-sample t-test for dependent samples here (null hypothesis: the mean of the difference is zero). However, a prerequisite for this test is that either the sample size is larger than 30 (rule of thumb) or the differences are normally distributed. If the differences are normally distributed, one can show that the test statistic follows a t-distribution.
The differences of the measured values have arithmetic mean  and sample standard deviation
  (rounded). This gives as test value
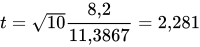 { "rounded".)
The non-rejection range of the null hypothesis at a significance level of α  results in
 ![[-2{,}262; +2{,}262]](https://www.alegsaonline.com/image/203fff272999e64875b2117cf56e547f97a3452e.svg) . Since the test value is outside the non-rejection range of the null hypothesis, it must be rejected.
. Since the test value is outside the non-rejection range of the null hypothesis, it must be rejected.
Non-parametric method
The non-parametric alternative to this is the sign test. Here, the null hypothesis is that the median is zero. In the normal distribution, the median and mean always agree, but this is not necessarily the case for other probability distributions. Here, exactly three differences are less than zero and seven are greater than zero. The test statistic follows a binomial distribution with  and
and  . The non-rejection range of the null hypothesis at a significance level of α results in
 ![[2; 8]](https://www.alegsaonline.com/image/b14a577eab2a513a0c532b425e611d48e693c905.svg) . Since three and seven are within the non-rejection range of the null hypothesis, it cannot be rejected.
. Since three and seven are within the non-rejection range of the null hypothesis, it cannot be rejected.
Advantages and disadvantages
In contrast to methods of non-parametric statistics, the methods of parametric statistics are based on additional distribution assumptions. If these assumptions are correct, they generally result in more accurate and precise estimates. If they are not correct, parametric methods often produce poor estimates; the parametric concept is then not robust to the violation of the distributional assumptions. On the other hand, parametric procedures are often easier and faster to compute. Sometimes fast computation is more important than non-robustness, especially when this is taken into account in the interpretation of statistics.
Questions and answers
Q: What is parametric statistics?
A: Parametric statistics is a branch of statistics that assumes the observations in the unknown population follow a probability distribution, with most of the parameters of the distribution being known.
Q: What is the main assumption of parametric statistics?
A: The main assumption of parametric statistics is that the observations in the unknown population follow a probability distribution.
Q: Who was the first to use the term "parametric statistics"?
A: Jacob Wolfowitz was the first to use the term "parametric statistics".
Q: What is the difference between parametric and non-parametric statistics?
A: The main difference between parametric and non-parametric statistics is that parametric statistics assume that the observations follow a probability distribution with known parameters, while non-parametric statistics make no assumptions about the population distribution.
Q: What are some examples of parametric statistical methods?
A: Examples of parametric statistical methods include t-tests, ANOVA, regression analysis, and Bayesian inference.
Q: Why are parametric statistical methods commonly used?
A: Parametric statistical methods are commonly used because they can provide more precise estimates of population parameters and can be more powerful than non-parametric methods if the assumptions are met.
Q: What are some limitations of parametric statistical methods?
A: Limitations of parametric statistical methods include the need for assumptions about the population distribution, sensitivity to outliers, and the potential for bias if the assumptions are not met.
Related articles
Author
AlegsaOnline.com Parametric statistics Leandro Alegsa
URL: https://en.alegsaonline.com/art/74549