
Ordinary Least Squares (OLS): method, properties, and applications
Ordinary least squares (OLS) is the standard method for estimating linear model parameters by minimizing squared residuals. Overview, assumptions, computation, uses, limitations, and common extensions.
Ordinary least squares (OLS) is a fundamental technique for estimating the coefficients of a linear relationship between predictors and an outcome. In practice OLS fits a linear model by choosing parameter values that minimize the sum of squared differences between observed responses and the values predicted by the model. OLS is central to statistics and is the usual estimator used in linear regression problems; it is also a special case of the broader family of least squares methods.
Image gallery
4 Images

How it works
In matrix form, if y denotes the observed outcomes and X the matrix of predictors, the OLS solution for the coefficient vector is often written as β̂ = (X'X)^{-1}X'y when X'X is invertible. For a single predictor this reduces to the familiar slope-intercept formulas. The procedure minimizes the sum of squared residuals r'i r i = (y_i - x_i'β)^2 and yields explicit expressions for fitted values and residuals.
Key assumptions and properties
- Linearity: the expected value of y is a linear function of predictors.
- Full column rank: predictors are not perfectly collinear so X'X is invertible.
- Exogeneity: errors have zero mean conditional on X.
- Homoscedasticity and no autocorrelation for best standard inference.
Under these assumptions, the Gauss–Markov theorem states that OLS is the Best Linear Unbiased Estimator (BLUE). If errors are also assumed normal, OLS estimates have well-known sampling distributions used for tests and confidence intervals.
Computation and diagnostics
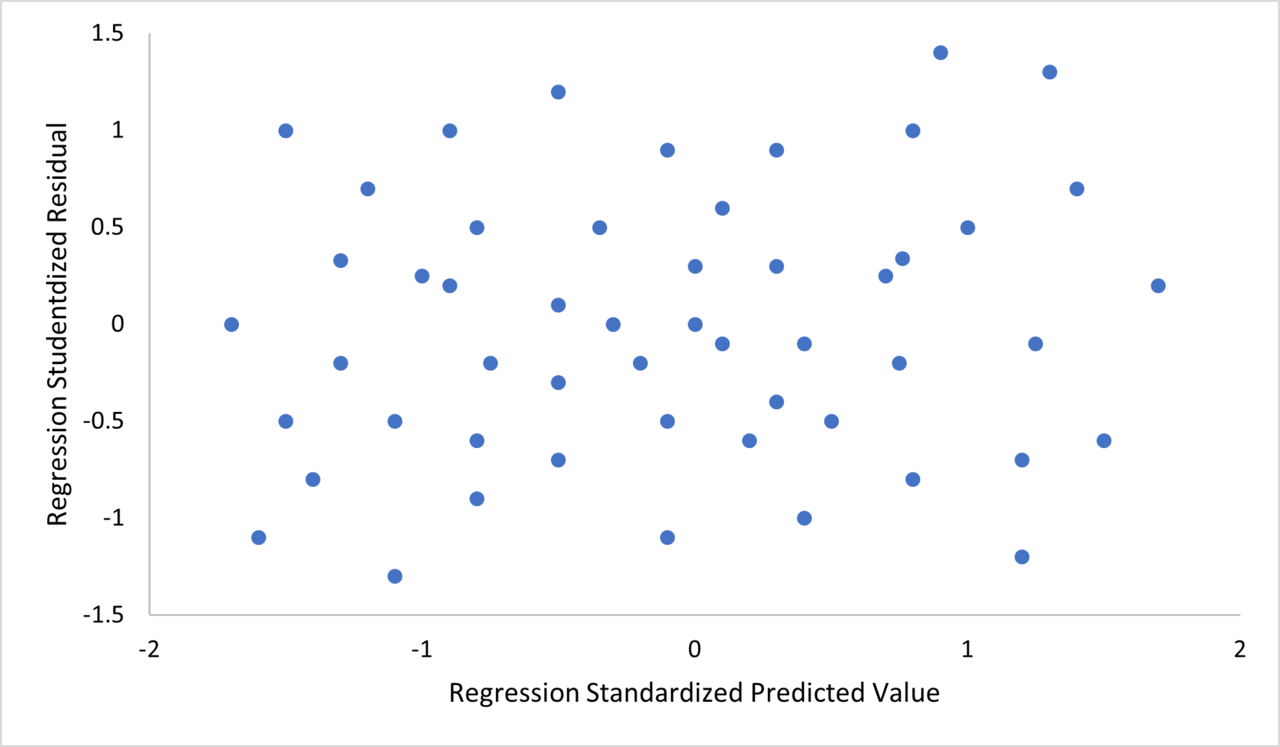
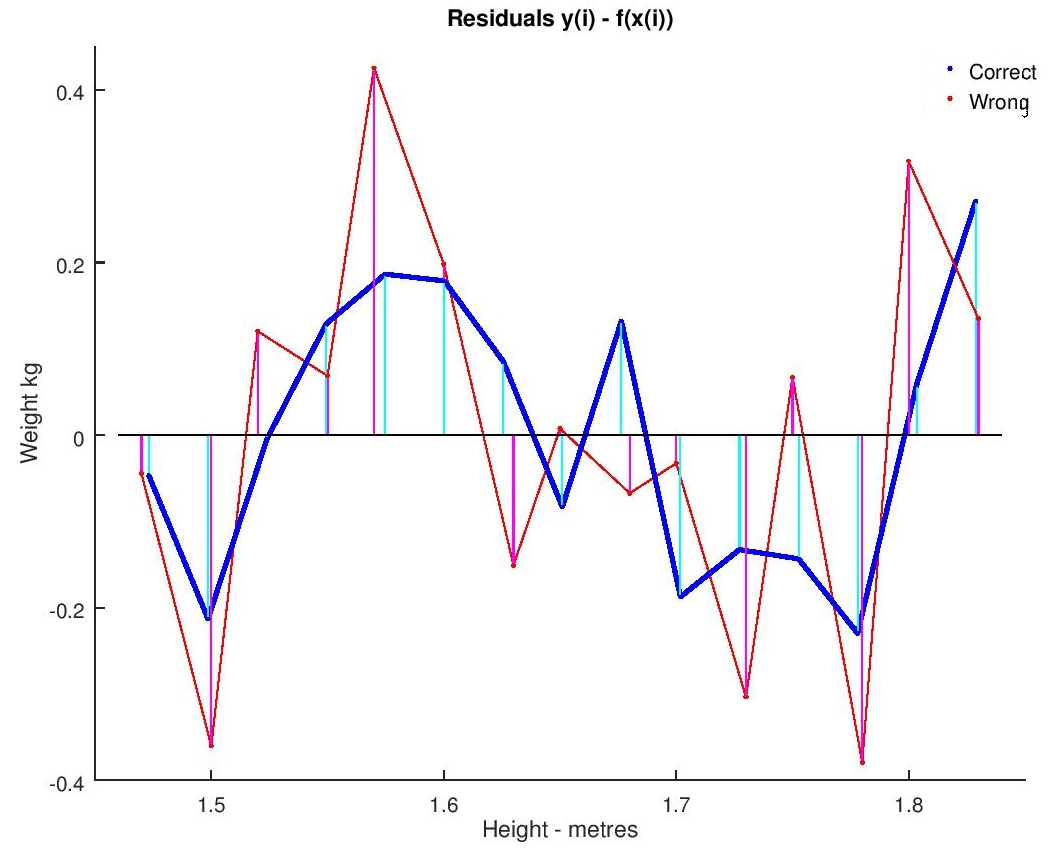
Although OLS has a closed-form matrix solution, numerical implementations often use more stable algorithms such as QR decomposition or singular value decomposition. Common diagnostic tools include residual plots, influence measures, R^2 and adjusted R^2, t-tests for coefficients, and the F-test for overall model fit. These help detect violations like heteroscedasticity, nonlinearity, or influential observations.
Uses, limitations and alternatives
OLS is widely applied in economics, social sciences, natural sciences, and engineering to quantify linear relationships and make predictions. Its limitations include sensitivity to outliers, bias when regressors are endogenous, and inflated variance under multicollinearity. When assumptions fail, practitioners may use weighted or generalized least squares, robust regression techniques, or instrumental variables. For heteroscedastic errors, weighted least squares corrects inefficiency; for correlated errors, generalized least squares or time-series methods are appropriate.
Historically, the method was developed in the context of astronomical and geodetic problems and later formalized in probability and statistics. Today OLS remains a practical, interpretable starting point for modeling numeric outcomes and often serves as a benchmark for more complex methods. For further technical details and proofs, consult standard statistical texts or introductory resources on linear regression and statistical estimation.
Questions and answers
Q: What is ordinary least squares (OLS)?
A: OLS is a statistical method used in linear regression to estimate unknown parameters. It aims to minimize the difference between observed responses and predicted responses by a linear approximation of the data.
Q: What is the goal of OLS?
A: The goal of OLS is to minimize the difference between observed responses and predicted responses. A smaller difference indicates that the model predicts the data more accurately.
Q: What is the resulting estimator in OLS?
A: The resulting estimator in OLS can be expressed by a simple formula.
Q: Is OLS a special case of least squares?
A: Yes, OLS is a special case of a method commonly called least squares.
Q: What kind of data does OLS work best with?
A: OLS works best with linear data, where there is a clear linear relationship between the predictor variable(s) and the response variable.
Q: What is the difference between observed responses and predicted responses in OLS?
A: Observed responses are the actual values of the response variable in the dataset, while predicted responses are the values of the response variable predicted by the linear model based on the predictor variable(s).
Q: How does OLS help in linear regression?
A: OLS helps in linear regression by providing a method to estimate unknown parameters and calculate the linear approximation of the data. This helps to identify the relationship between predictor variable(s) and the response variable, and to make predictions based on this relationship.
Related articles
Author
AlegsaOnline.com Ordinary Least Squares (OLS): method, properties, and applications Leandro Alegsa
URL: https://en.alegsaonline.com/art/73036