
Nomogram: graphical calculators and alignment charts
Nomograms are two-dimensional graphical calculators that let users solve equations by aligning scales with a straightedge; historically important in engineering and still used for specialized field calculations.
A nomogram (also called an alignment chart or abaque) is a graphical tool that encodes a mathematical relationship so a value can be found by inspection rather than algebraic manipulation. The diagram presents several scales—one for each variable in an equation—arranged so that drawing a straight line through the known values intersects the unknown scale at the solution. Nomograms were widely used in the pre-digital era to speed routine computations in engineering, science and medicine.
Image gallery
6 Images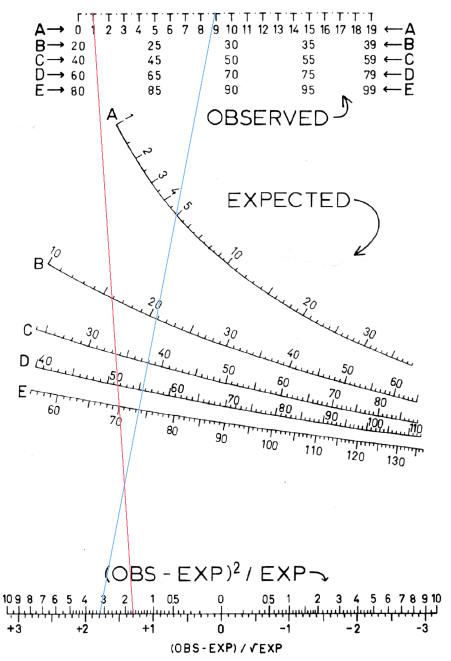


Basic concept and how to read one
A typical nomogram has three or more scales. Given numerical values on two scales, a straightedge placed through them will cross a third scale at the corresponding solution. The line traced by the straightedge is often called an index line or isopleth. Scales may be linear, logarithmic or specially graduated to represent non‑linear functions. Construction can use transformed coordinates so that the geometric alignment corresponds to the original algebraic relation.
Components and common designs
- Scales: One scale per variable; graduations reflect the mathematical transform (linear, log, reciprocal, etc.).
- Index line / isopleth: The straight line connecting known values.
- Frame and annotations: Labels, units, and auxiliary guides for interpolation and error estimation.
Some common nomogram layouts include three parallel linear or logarithmic scales for simple multiplicative relations and more elaborate net or grid designs for multivariable formulae. The underlying plotting technique uses a parallel coordinate approach rather than standard Cartesian coordinates; for background on this representation see parallel coordinate system.
History and development
Nomography — the science of creating nomograms — was pioneered in the late 19th century by the French engineer Philbert Maurice d'Ocagne (1862–1938). He formalized the use of graphical alignment for computation and developed systematic methods for transforming equations into scale layouts. Throughout the 20th century, nomograms appeared in engineering handbooks, technical manuals and pocket charts where quick field calculations were needed.
Uses, advantages and limitations
Nomograms were especially valuable when electronic calculators were unavailable or inconvenient. They provided rapid answers without arithmetic, were robust in field conditions, and made dependencies between variables visually apparent. Common historical and modern applications include engineering design checks, hydraulics and fluid flow approximations, aeronautical performance charts, and medical dosing aids such as body‑surface‑area dosing charts.
Advantages: speed, visual intuition, no power required and suitability for routine repetitive tasks. Limitations: finite precision (dependent on scale graduation and reader skill), limited range and the need to produce a new nomogram if the underlying formula changes. They are not a substitute for symbolic analysis when exact algebraic manipulation or high precision is required.
Construction and examples
Designing a nomogram involves algebraically transforming the equation so that the relation among variables becomes a linear alignment in the chosen geometric layout. Simple products and ratios are often handled by logarithmic scales; quadratic or more complex dependencies require engineered graduations or multiple auxiliary scales. Practical examples one might encounter are quick charts to convert units, approximate heat transfer coefficients, or estimate doses based on standard clinical parameters. For a formal definition of the function represented on a chart see mathematical function.
Although digital calculators and software have reduced the everyday reliance on nomograms, they remain useful educational tools for teaching functional relationships and still appear in specialized reference materials where immediate, visual answers are preferred.
Questions and answers
Q: What is a nomogram?
A: A nomogram is a graph used for calculation, which gives a computation of a mathematical function.
Q: Who invented the field of nomography?
A: The field of nomography was invented by Philbert Maurice d’Ocagne, a French engineer, in 1884.
Q: What was the purpose of nomograms?
A: Nomograms were used for many years to provide engineers with fast graphical calculations of complicated formulas.
Q: How many scales does a nomogram consist of?
A: A nomogram consists of a set of n scales, one for each variable in an equation.
Q: How can the value of an unknown variable be found using a nomogram?
A: Knowing the values of n-1 variables, the value of the unknown variable can be found by laying a straightedge across the known values on the scales and reading the unknown value from where it crosses the scale for that variable.
Q: What is the virtual or drawn line created by the straightedge called?
A: The virtual or drawn line created by the straightedge is called an index line or isopleth.
Q: What kind of coordinate system is used in nomograms?
A: Nomograms use a parallel coordinate system invented by d'Ocagne rather than standard Cartesian coordinates.
Related articles
Author
AlegsaOnline.com Nomogram: graphical calculators and alignment charts Leandro Alegsa
URL: https://en.alegsaonline.com/art/70590