Astronomical spectroscopy: principles, history, and applications
Study of spectra from astronomical objects to determine composition, motion, temperature and other physical properties across the electromagnetic spectrum, from radio to gamma rays.
Astronomical spectroscopy is the observational science of measuring and interpreting the spectrum of electromagnetic radiation from celestial sources. By dispersing light or other radiation into its component wavelengths, astronomers identify characteristic patterns of absorption and emission that reveal physical and chemical properties of stars, planets, nebulae and galaxies. For an introductory technical overview see spectroscopy.
Image gallery
4 Images


How spectra form and what they show
Spectra arise from interactions between matter and radiation. A hot, dense body emits a continuous spectrum whose shape is influenced by temperature; cooler gas in front of a continuum source produces dark absorption lines; and low-density, excited gas produces bright emission lines. The positions and relative strengths of spectral features correspond to electronic, ionic or molecular transitions and therefore to particular elements and compounds. Molecular bands become important in cool stars and planetary atmospheres. Forbidden transitions, which occur under low-density conditions, produce characteristic emission lines in nebulae and the interstellar medium. Basic methodological descriptions are available at spectroscopic methods.
Instruments and techniques
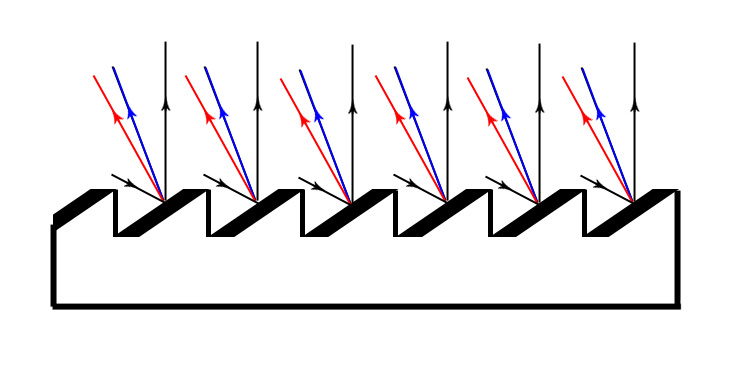
Spectrographs disperse incoming radiation using prisms, diffraction gratings or interferometric devices; modern high-resolution instruments often use echelle gratings and cross-dispersers to cover wide wavelength ranges. Light can be collected via single slits, multi-slit masks or optical fibers for large surveys. Detectors vary by band: CCDs are common in optical work, infrared arrays in the near- and mid-infrared, and bolometers or superconducting detectors at longer or shorter wavelengths. Practical implementations and instrument descriptions are discussed in resources on astronomical bodies and instrument pages at observatory notes.
Key spectral diagnostics
- Chemical composition: Atomic and molecular lines identify elements and molecules present in atmospheres and gas clouds.
- Radial velocity and motion: Shifts from laboratory rest wavelengths (the Doppler effect) measure motion toward or away from the observer and, at cosmological scales, galaxy redshift.
- Temperature and continuum shape: The overall energy distribution and line excitation give temperature estimates for photospheres and plasmas.
- Density and pressure: Line ratios, collisional broadening and forbidden-to-permitted line strengths constrain densities and pressures.
- Magnetic fields: Zeeman splitting and polarization of lines reveal magnetic field strengths and geometry.
- Ionization and excitation state: Presence of ions and their relative populations indicate ionization conditions and radiation fields.
These diagnostics use comparisons with laboratory data, theoretical models and spectral libraries. Important background on the nature of electromagnetic radiation and spectra can be found at electromagnetic spectrum and electromagnetic radiation.
Applications
- Stellar astrophysics: Spectral classification traces temperature, composition and evolutionary status; detailed abundance studies inform models of stellar nucleosynthesis.
- Galaxy studies and cosmology: Redshifts from galaxy spectra measure cosmic expansion and map large-scale structure.
- Interstellar medium and nebulae: Emission-line diagnostics map physical conditions, chemical enrichment and kinematics within gas clouds.
- Exoplanet atmospheres: Transmission and emission spectroscopy during transits and eclipses can detect molecules, clouds and temperature profiles.
- Solar and planetary science: High-resolution spectra of the Sun and planets reveal dynamics, composition and magnetic activity.
Examples of commonly used spectral diagnostics include hydrogen and helium lines in hot stars, molecular bands and alkali lines in cool dwarfs and brown dwarfs, and forbidden lines such as those used to diagnose nebular conditions. Surveys and large instruments balance spectral resolution, sensitivity and wavelength coverage; summaries of survey designs and targets appear in materials on stellar spectroscopy basics and spectral line studies.
Practical considerations and limitations
Quality and interpretation of spectra depend on spectral resolution, signal-to-noise ratio, wavelength calibration and flux calibration. Observers must correct for Earth's motion and atmospheric absorption (telluric features) and consider instrumental effects such as scattered light and detector nonlinearity. Radiative transfer modeling is required to infer physical conditions; often simplifying assumptions such as local thermodynamic equilibrium (LTE) are used, but non-LTE effects can be important in rarefied or strongly irradiated environments. For methods of measuring velocities and handling data reduction see guides on spectroscopic surveys and radial velocities.
Historical notes and context
Astronomical spectroscopy developed in the 19th century with studies of solar and stellar spectra and the realization that dark lines correspond to chemical elements. Laboratory spectroscopy and theoretical advances transformed the field into a quantitative discipline. Over time, spectroscopy has expanded from optical wavelengths to include radio, infrared, ultraviolet, X-ray and gamma-ray bands, each revealing different physical processes. Comprehensive data compilations and instrument archives support ongoing research; see spectral databases and observatory resources for further exploration.
Notes: Spectroscopic results are interpreted within observational uncertainties and model limitations. Continued advances in detectors, calibration techniques and computational modeling steadily improve the precision and scope of astronomical spectroscopy.
Questions and answers
Q: What is astronomical spectroscopy?
A: Astronomical spectroscopy is the science of using spectroscopy to determine what elements astronomical bodies are made of and how they are moving.
Q: What can spectroscopy be used for in astronomy?
A: Spectroscopy is used to help scientists study the whole spectrum of electromagnetic radiation from stars and other hot celestial objects. It can find out their chemical composition, temperature, density, mass, distance, luminosity, and relative motion using doppler effect measurements.
Q: What is the doppler shift?
A: The doppler shift is a change in the wavelength of electromagnetic radiation caused by the movement of an object.
Q: How can spectroscopy be used to determine distant object properties?
A: Spectroscopy can be used to determine the chemical composition, temperature, density, mass, distance, luminosity, and relative motion of distant stars and galaxies.
Q: What is the relationship between spectroscopy and electromagnetic radiation?
A: Spectroscopy is used in astronomy to study the whole spectrum of electromagnetic radiation, including visible light, which radiates from stars and other hot celestial objects.
Q: What is the importance of astronomical spectroscopy?
A: Astronomical spectroscopy is important because it allows scientists to determine the properties of distant objects that would otherwise be impossible to study.
Q: How can doppler effect measurements be used in astronomical spectroscopy?
A: Doppler effect measurements can be used to determine the relative motion of stars and galaxies, which can provide information on their distance and velocity.
Related articles
Author
AlegsaOnline.com Astronomical spectroscopy: principles, history, and applications Leandro Alegsa
URL: https://en.alegsaonline.com/art/6841