
Mercator projection
Cylindrical conformal map projection introduced by Gerardus Mercator (1569). Preserves local angles and straight rhumb lines but greatly enlarges high-latitude areas; used for navigation and web maps.
Overview
The Mercator projection is a cylindrical, conformal map projection developed and first published by Gerardus Mercator in 1569. It represents meridians as vertical, equally spaced lines and parallels of latitude as horizontal lines whose spacing increases with latitude. Because the projection preserves angles locally (conformality), it renders compass bearings as straight lines, which historically made it valuable for maritime navigation and route plotting.
Image gallery
10 Images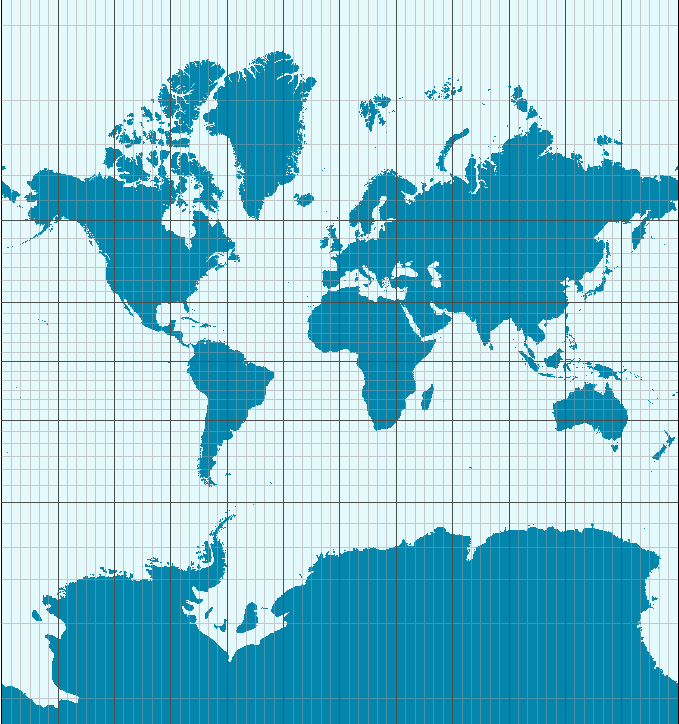


Construction and basic mathematics
On a spherical model of the Earth the Mercator projection can be described by simple relations: longitude is mapped linearly to the x-coordinate, while latitude is transformed by a logarithmic function of the tangent of half the latitude to produce the y-coordinate. In common notation, for a sphere of radius R and a central meridian λ0, the mapping can be written in basic form as x = R(λ − λ0) and y = R ln(tan(π/4 + φ/2)), where φ is latitude. On an ellipsoid the formulas use a related conformal latitude or isometric latitude and are more complex but follow the same principle of vertical stretching to preserve angles.
Key properties
- Conformal: local shapes and angles are preserved, so small features maintain their geometry.
- Rhumb lines: straight lines on the projection correspond to lines of constant compass bearing (loxodromes), which is why the projection was prized for navigation.
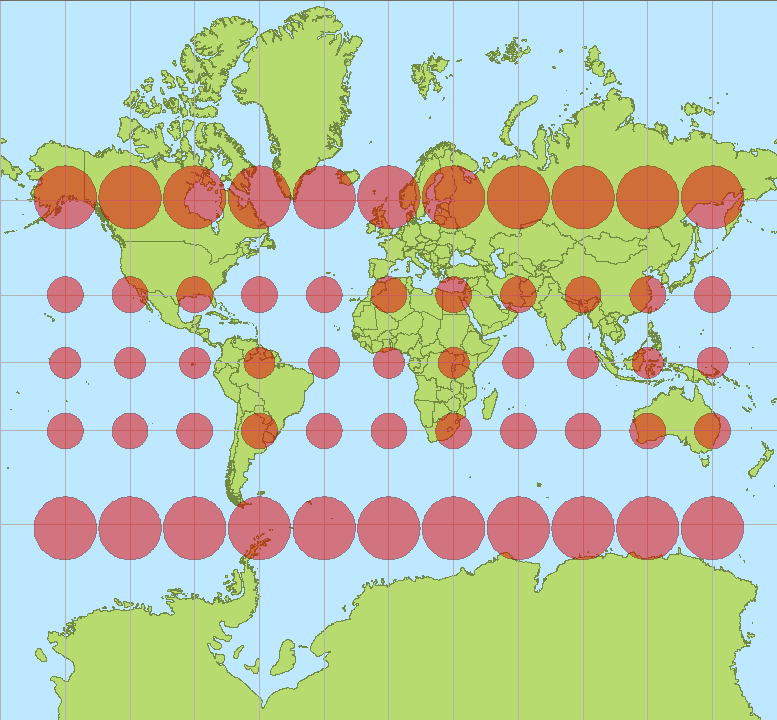
- Scale distortion: scale varies with latitude and increases without bound toward the poles; roughly, linear scale increases by a factor related to 1/cos(φ) on a spherical model, so high-latitude areas are greatly exaggerated.
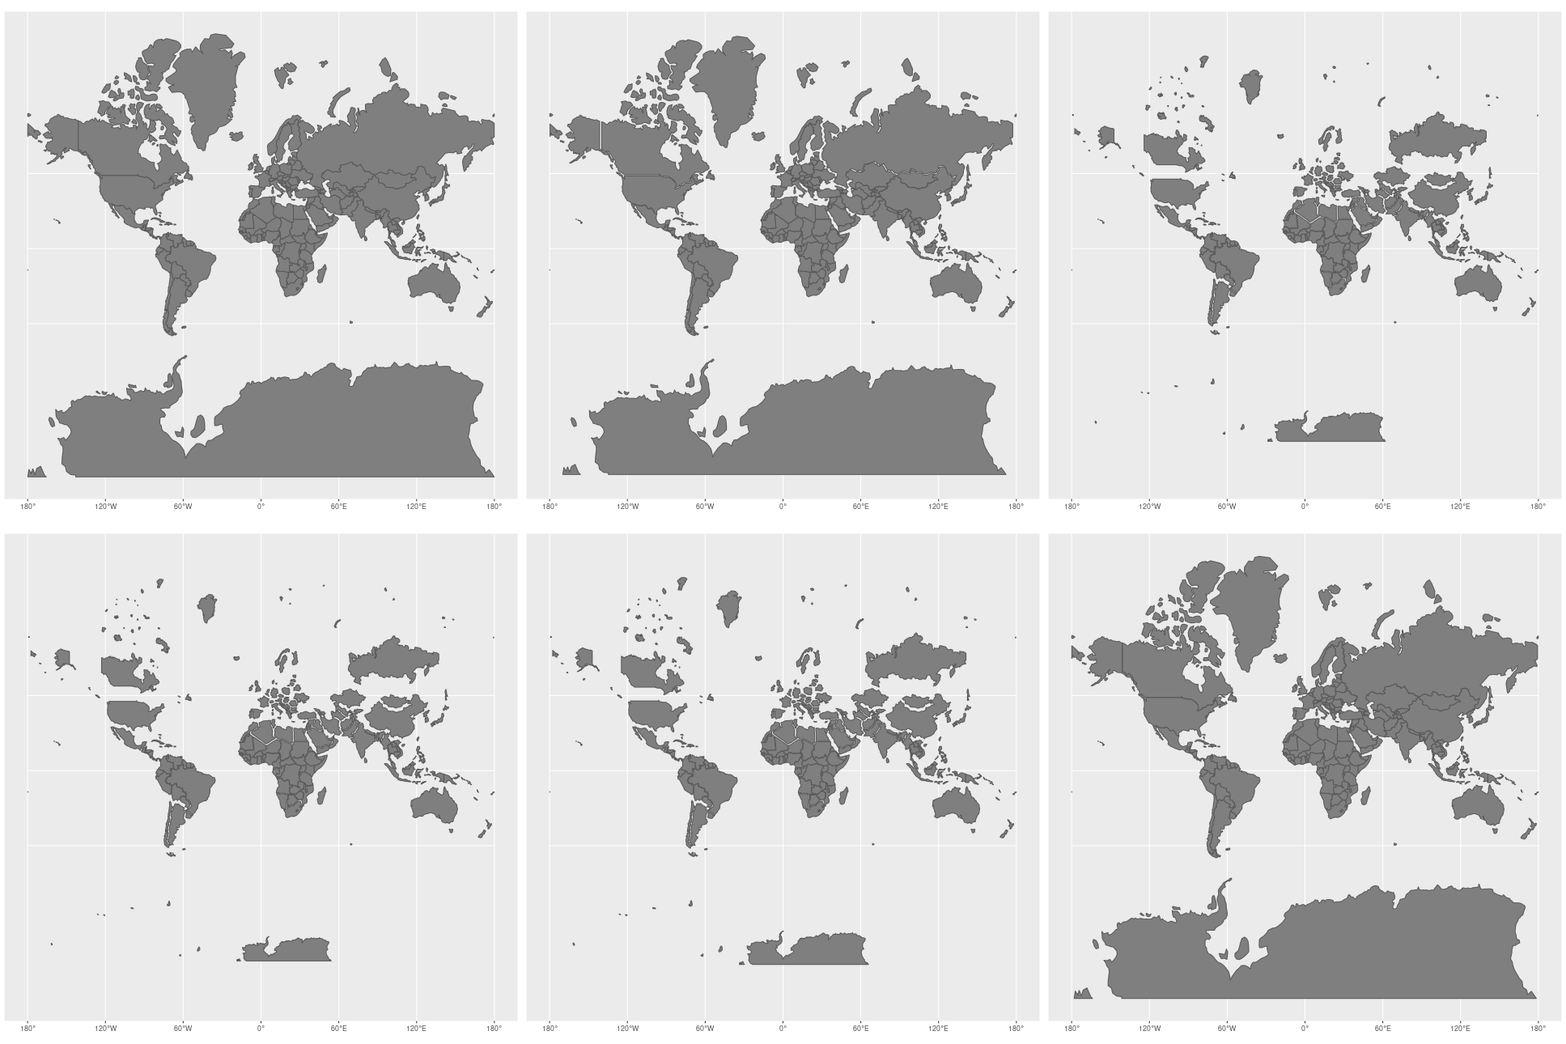
- Not equal-area: areas are not preserved; continents and countries near the poles appear much larger than their true area on the globe.
History and development
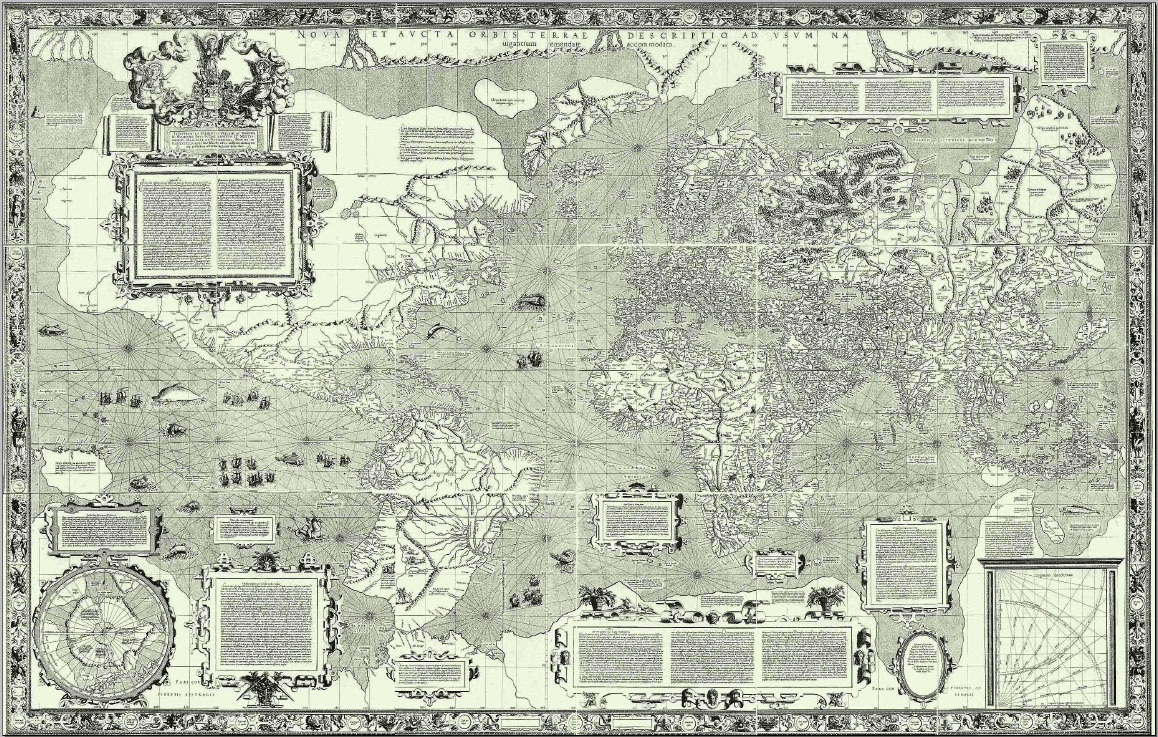
Mercator introduced his projection to aid seafarers in plotting a straight-line course that maintained a constant compass heading. Early implementations were hand-drawn on parchment and copperplate. Over succeeding centuries cartographers and mathematicians refined the mathematical description, adapting the projection for more accurate ellipsoidal Earth models and for different practical applications. The projection’s utility for navigation ensured its wide adoption on nautical charts and world maps for several centuries.
Uses in modern cartography and technology
The Mercator projection continues to be used where its defining properties are advantageous. Nautical charts for mid-latitude navigation and some technical maps still employ Mercator-based charts because straight rhumb-line plotting remains convenient. In digital mapping, a variant called Web Mercator (often used in online "slippy" maps and many GIS web tile services) approximates the Earth as a sphere to simplify tiling and computation; this variant is commonly referred to in technical contexts under identifiers such as EPSG:3857. The projection’s simple rectangular grid and ability to be tiled consistently are reasons for its widespread use in interactive maps and mapping APIs.
Criticism and limitations
Because area distortion becomes extreme toward the poles, the Mercator projection distorts the apparent relative sizes of countries and continents. A frequently cited example is the comparative appearance of Africa and Greenland: on many Mercator world maps Greenland appears similar in size to Africa, even though Africa is many times larger on the globe. Critics point out that such distortions can mislead readers about the real geographic scale of regions and can carry cultural or geopolitical bias if used without qualification.
Alternatives and when to use them
Cartographers choose projections to match a map’s purpose. When accurate area relationships are important, equal-area projections such as the Gall–Peters or sinusoidal projections are preferred. For balanced aesthetic world maps, compromise projections like the Robinson or Winkel Tripel reduce extreme distortion of shape and area. Azimuthal and conic projections serve particular regional and polar mapping needs. The choice between projections depends on whether preserving angles, distances, areas, or directions is most important for the map’s intended use.
Practical notes and further reading
For introductory material on map projections and cartographic practice see general cartography references and educational resources; specific technical treatments discuss the spherical and ellipsoidal forms of the Mercator formulas, scale factors, and numerical methods for implementation. For general context about cylindrical projections see discussions of cylindrical projections and related families, and for broader mapping topics consult materials on cartography and the geometric foundations of projection theory at sources addressing geometric map-making principles. Historical overviews and reproductions of early maps may be found in collections that describe Mercator’s life and work and his 1569 world map; further curated material on maps is available through general map resources and educational sites (maps).
Questions and answers
Q: What is the Mercator projection?
A: The Mercator projection is a cylindrical map projection which is widely used in cartography today.
Q: Who developed the Mercator projection?
A: The Mercator projection was developed by Gerardus Mercator in 1569.
Q: Can the Mercator projection be constructed using geometric tools?
A: No, the Mercator projection is not a physical projection, and cannot be constructed using geometric tools.
Q: What is the property of Mercator projection known as conformity?
A: The property of Mercator projection known as conformity means that on a small scale, geometric shapes can be moved around the map, without distorting them.
Q: What is a downside of the Mercator projection?
A: A downside of the Mercator projection is that the scale of the shape and the direction of lines may change when shapes are moved.
Q: Can the Mercator projection accurately represent the relative size of shapes on a map?
A: No, the Mercator projection cannot accurately represent the relative size of shapes on a map. For example, Africa is actually 15 times larger than Greenland, but on this map projection they look the same size.
Q: What is the main purpose for which Mercator projections are used today?
A: Mercator projections are mainly used for maps today.
Related articles
Author
AlegsaOnline.com Mercator projection Leandro Alegsa
URL: https://en.alegsaonline.com/art/63866