Marginal propensity to consume (MPC)
The marginal propensity to consume (MPC) is the fraction of an additional unit of disposable income that households spend on consumption rather than save, shaping fiscal multipliers and consumption responses.
In economics, the marginal propensity to consume (MPC) measures how much of an extra unit of disposable income is spent on consumption rather than saved. It quantifies induced consumption: the increase in consumer spending that follows a rise in disposable income. When a household receives one additional dollar of after‑tax income, the MPC is the share of that dollar that will be spent rather than put aside.
Image gallery
1 Image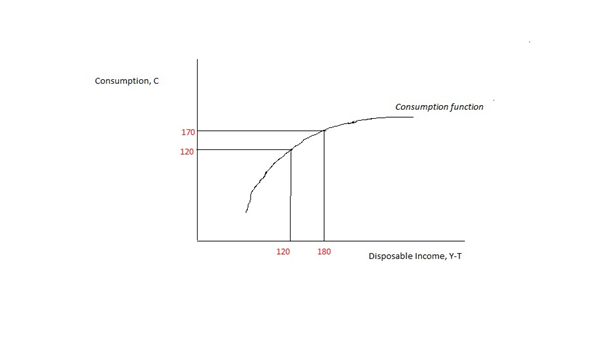
Definition and simple formula
Formally, MPC is the change in consumption divided by the change in disposable income: MPC = ΔC / ΔYd. In most models MPC lies between 0 and 1, meaning households spend some portion and save the rest. For example, if MPC = 0.65, a $1 increase in disposable income leads to $0.65 more consumption and $0.35 more saving. Classical and Keynesian texts typically assume MPC is less than one.
Key characteristics and examples
- Range: Economically plausible values are usually between 0 and 1. Values near zero imply little extra spending; values near one imply most extra income is consumed.
- Short‑run vs long‑run: MPC can differ over time. Immediate spending responses may be larger or smaller than long‑run adjustments once expectations and durable goods replaceable cycles are accounted for.
- Example: If MPC = 0.8, a temporary $100 payment raises consumption by about $80; if MPC = 0.3, consumption rises only $30.
Determinants and variation across groups
The MPC is not uniform. Wealth, income level, access to credit, and expectations about future income affect how much of an extra dollar is spent. Lower‑income households typically have higher MPCs because they face binding consumption needs and limited capacity to save, while wealthier households tend to save a larger portion of additional income. Liquidity constraints, unemployment risk and confidence about future incomes also raise or lower the MPC for particular groups.
Importance in macroeconomics and the multiplier
MPC is central to fiscal policy analysis because it determines the size of the spending multiplier. The simple spending multiplier in a closed economy without taxes is given by 1 / (1 − MPC). A higher MPC implies a larger multiplier: for instance, an MPC of 0.8 generates a multiplier of 5, so initial spending creates several times that amount of total output through rounds of re‑spending. Real‑world multipliers are smaller when there are taxes, imports, or supply constraints, which act as leakages from the spending stream.
Measurement, caveats and distinctions
Empirical estimation of MPCs uses household surveys, tax data and natural experiments such as stimulus payments. Distinguish marginal from average propensity to consume (APC): APC is consumption divided by total income, while MPC concerns the response to an incremental change. Also note temporary versus permanent income effects: under permanent income or life‑cycle hypotheses, a one‑off payment may have a smaller MPC than a lasting income change. While some short‑term behavior (borrowing or dissaving) can make apparent MPCs exceed one for isolated payments, sustained MPCs above one are not typical.
Historical and theoretical notes
John Maynard Keynes emphasized the role of propensity to consume in driving aggregate demand and argued that MPC is an important behavioral parameter in the short run; classic Keynesian frameworks assume MPC < 1. Modern macroeconomic models incorporate heterogeneous MPCs across households to analyze distributional effects of policy and to better predict the impact of tax changes and transfers. For further conceptual background see discussions of induced consumption and consumption functions at induced consumption and basic consumption theory at consumption. For historical context and Keynesian theory refer to materials on John Maynard Keynes.
Understanding MPC helps policymakers anticipate how fiscal measures will translate into consumer spending and aggregate demand, and it highlights why targeting transfers to households with higher MPCs can yield larger short‑run effects on consumption.
Questions and answers
Q: What is the marginal propensity to consume (MPC)?
A: The marginal propensity to consume (MPC) is a measurement that quantifies induced consumption, which is the idea that an increase in personal consumer spending happens with an increase in disposable income after taxes and transfers.
Q: How does MPC work?
A: MPC measures the proportion of more income that a person spends. For example, if a household earns one extra dollar of disposable income, and the marginal propensity to consume is 0.65, then the household will spend 65 cents and save 35 cents of that dollar.
Q: Who proposed MPC?
A: John Maynard Keynes proposed MPC.
Q: Is MPC less than one?
A: Yes, according to John Maynard Keynes, MPC is less than one.
Q: Does MPC vary between rich and poor people?
A: Yes, typically the MPC is higher for poorer people than in rich people.
Q: What happens when a household earns an extra dollar of disposable income?
A: If the marginal propensity to consume for this household is 0.65, then they will spend 65 cents and save 35 cents of that dollar.
Q: Can households spend more than their extra dollar without borrowing?
A No, households cannot spend more than their extra dollar without borrowing money from another source.
Related articles
Author
AlegsaOnline.com Marginal propensity to consume (MPC) Leandro Alegsa
URL: https://en.alegsaonline.com/art/61774
Sources
- books.google.com : Marginal propensity to consume
- books.google.com : Marginal propensity to consume