Los Angeles
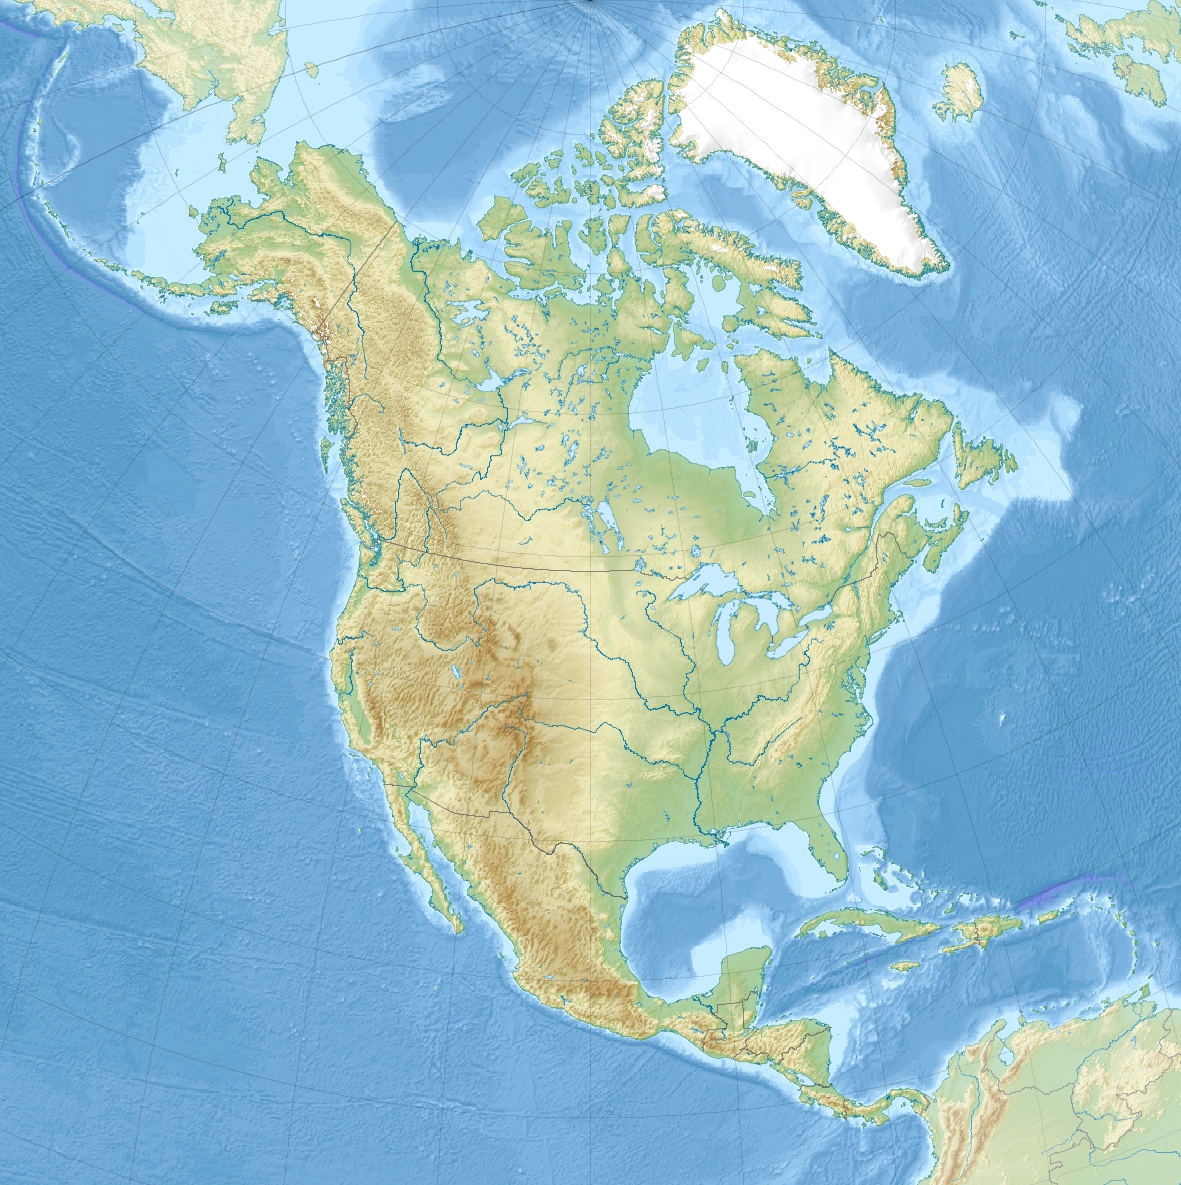
Los Angeles is a major coastal city in Southern California, a global center of film, culture and trade. It is California's largest city, noted for its diversity, creative industries and sprawling metropolitan region.
Overview
Los Angeles is a major coastal city in Southern California within the United States. The city is the largest in the state of California and one of the largest in the country. Los Angeles serves as a regional hub for entertainment, commerce, higher education and international trade. While population figures vary over time, the city itself contains several million residents and anchors a densely populated metropolitan area that extends across many municipalities.
Image gallery
10 Images


History
Established as a Spanish pueblo in 1781, Los Angeles developed under Spanish and later Mexican rule before becoming part of the United States in the nineteenth century. Its early economy centred on ranching and agriculture; the arrival of railroads, oil discoveries and industrial development helped the city expand rapidly in the late 19th and early 20th centuries. The growth of the motion picture industry in Hollywood transformed Los Angeles into a worldwide centre for film and later television production.
Geography and environment
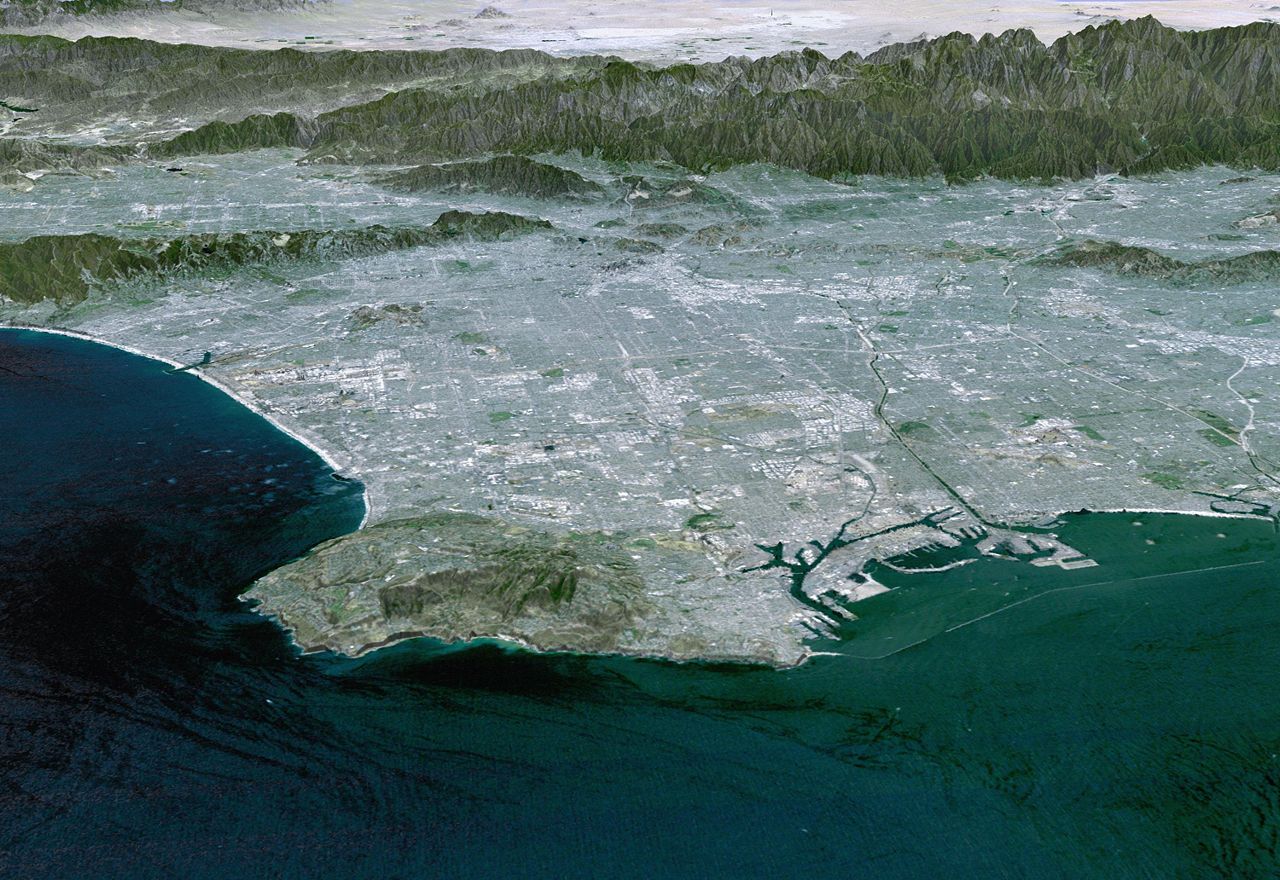
Los Angeles occupies a broad coastal basin bounded by the Pacific Ocean and by mountain ranges to the north and east. The region includes beaches, river valleys and hills, and supports a range of ecosystems from coastal scrub to chaparral. Parts of the area are crossed by active geological faults, and earthquake risk has shaped building codes and land-use planning. The city's physical form is famously sprawling, with distinct neighborhoods and commercial centres spread across a wide area rather than concentrated in a single dense core. For information on the central business district see downtown Los Angeles.
Climate
Los Angeles has a Mediterranean-type climate characterized by warm, dry summers and mild winters with most rainfall occurring between late autumn and early spring. Microclimates are common across the region: coastal areas often experience cooler, maritime conditions, while inland valleys can be considerably hotter in summer. Air quality and water resources have been recurring policy concerns throughout the city's modern history.
Demographics and neighborhoods
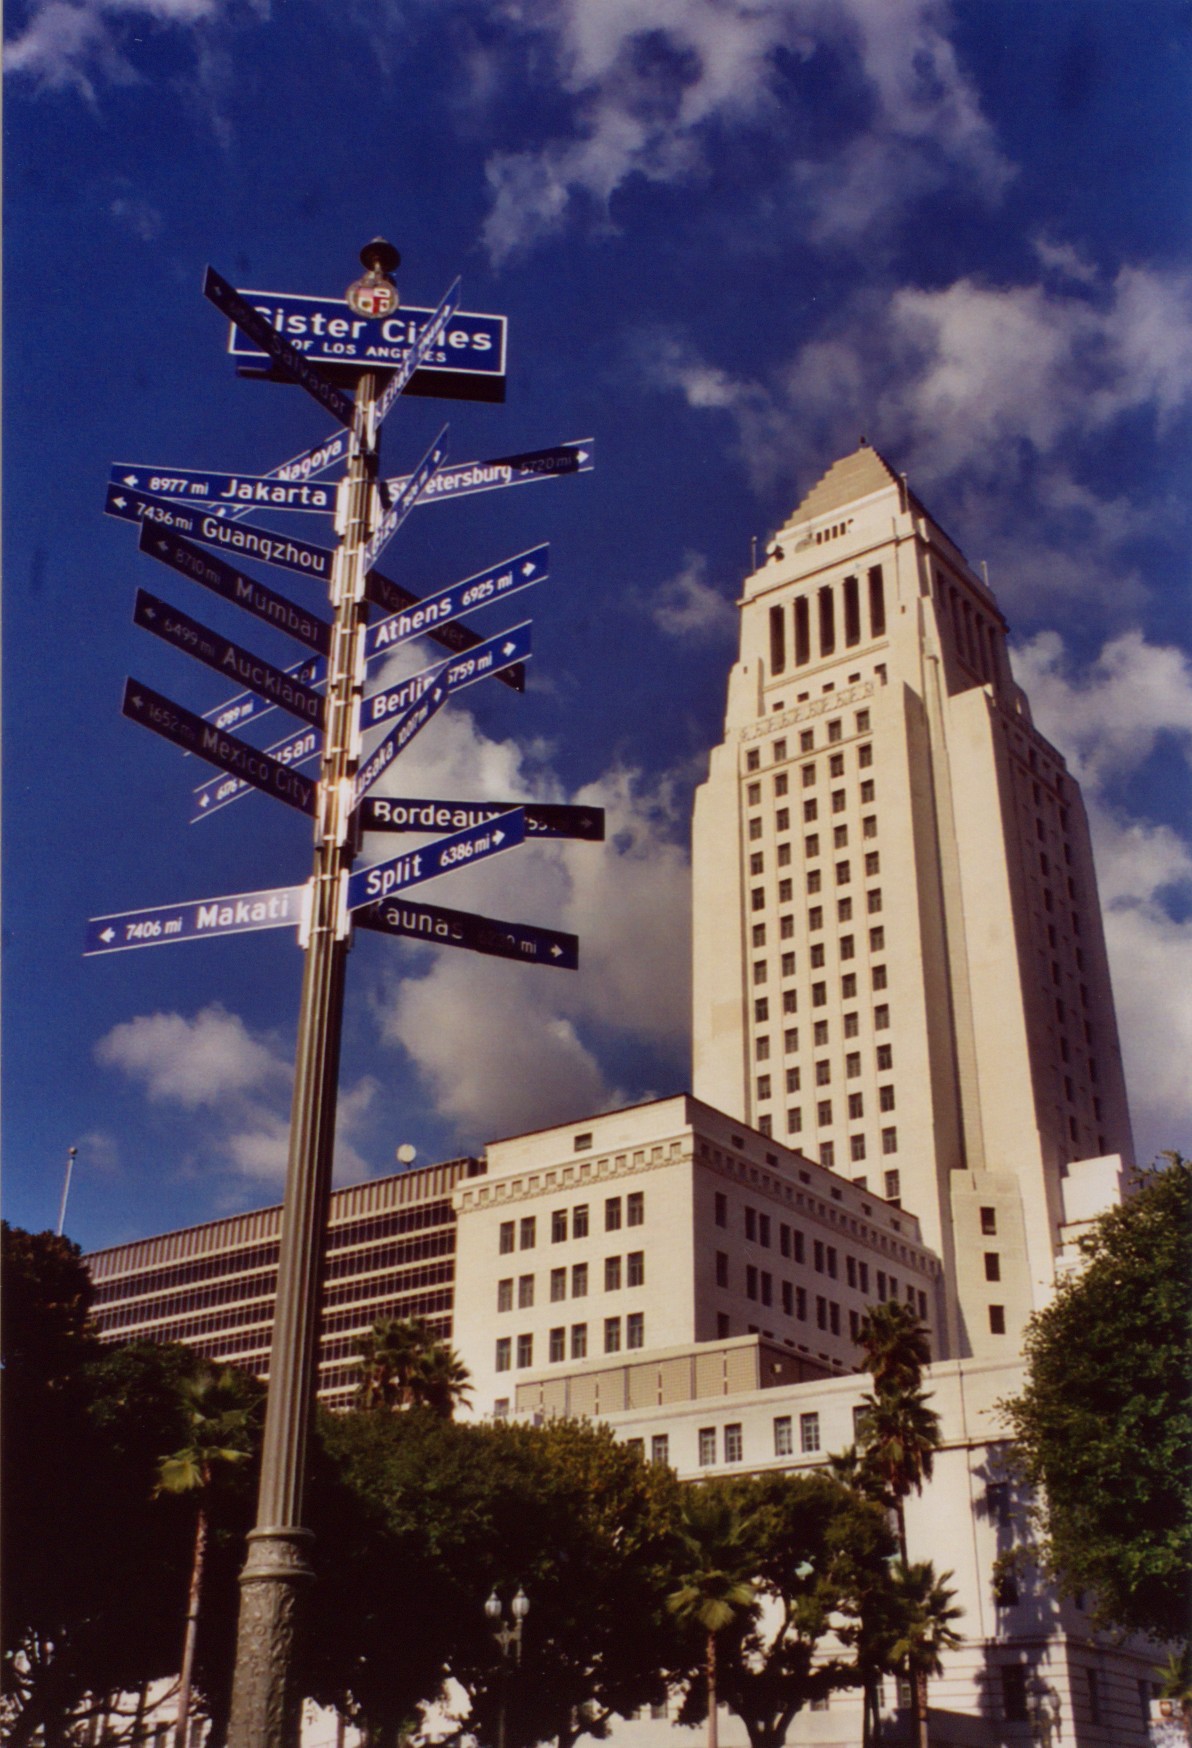
The city is one of the most ethnically and culturally diverse in the United States. Large communities of Hispanic, Asian, African American and other backgrounds shape the linguistic, culinary and religious life of the metropolitan area. Los Angeles has a significant Hispanic and Latino population, including many residents of Mexican and Central American heritage, and is home to well-known districts such as Koreatown, Little Tokyo and Boyle Heights. Neighborhood identities are strong and local civic institutions, cultural centres and markets reflect decades of immigration and community life.
Culture and entertainment
Los Angeles is widely recognised as a global centre for the creative industries. The film and television sector, founded around Hollywood, continues to be a major cultural and economic force. The region also supports music, fashion, visual arts and a lively independent arts scene. Famous performers and many celebrities live or work in the area, and major studios, galleries and performance venues attract international attention.
Economy and transport
The city's economy is diverse: beyond entertainment it includes international trade through major port facilities, aerospace and advanced manufacturing, technology and a growing service and startup sector. Transportation has long been oriented to the automobile, supported by an extensive freeway network, though recent investments have expanded rail and bus rapid transit options. Los Angeles International Airport and other regional airports connect the city globally, while the ports of Los Angeles and Long Beach rank among the busiest in the nation.
Government, planning and challenges
Municipal government in Los Angeles oversees a large and complex urban area and coordinates with county, state and federal agencies on issues such as housing, transportation and environmental protection. The city faces persistent challenges including housing affordability, traffic congestion, air quality and resilience to earthquakes and wildfires. Urban planners and civic leaders pursue a mix of policies to increase housing supply, expand public transit and reduce greenhouse gas emissions.
Comparative context and significance
Historically Los Angeles ranks among the most populous U.S. cities, often placed after New York City and ahead of Chicago in city population counts; comparisons depend on the specific measures and years in question. Its cultural influence, economic links across the Pacific Rim and role as a destination for migrants and visitors make Los Angeles a consequential global city.
Quick facts
- Major districts: Downtown, Hollywood, Westside, San Fernando Valley, South Los Angeles, Harbor area.
- Key industries: Film and television, ports and logistics, aerospace, technology, tourism and higher education.
- Ongoing priorities: housing, transportation, environmental sustainability and disaster resilience.
For further reading and specific municipal information consult official city resources and regional planning agencies available through local portals and archives.
Los Angeles has a long cultural and economic reach that continues to evolve; it remains a focal point for creative production, international trade and diverse community life in the United States and beyond. The city's story connects to broader histories of settlement, migration and technological change that shaped the modern American West. For historical references and civic guides consult archives and regional studies linked from local institutions.
Contextual comparisons and civic resources are available in regional histories and urban studies that treat Los Angeles alongside other major cities such as New York and Chicago.
City name
The town was officially founded on 4 September 1781 by the Spanish governor Felipe de Neve as El Pueblo de la Reina de Los Ángeles (Spanish: "The Village of the Queen of Angels"). The name thus referred to Mary as the Queen of Angels, a Marian title taken from the Lauretan Litany. The present name Los Angeles is a shortening of the founding name to "the angels".
Widely used was originally also the unofficial name El Pueblo de Nuestra Señora la Reina de los Ángeles del Río de Porciúncula [el ˈpweβlo de ˈnwestɾa seˈɲoɾa la ˈrei̯na de los ˈaŋxeles del ˈrio de poɾsiˈuŋkula]. (The Village of Our Lady, Queen of Angels of the River Portiuncula). It makes specific reference to the Basilica of Santa Maria degli Angeli in Assisi, built over the Portiuncula Chapel, where Francis of Assisi died. He was the founder of the order that included the missionaries who came to America with the explorers.
Contrary to popular belief that this was the original name, scholars have determined from official documents of Governor Felipe de Neve, Commander General Theodor de Croix, and Viceroy Antonio María de Bucareli y Ursúa that the settlement was simply called El Pueblo de la Reina de Los Ángeles.
The abbreviation often used (also colloquially) is "L.A.". Because of the Spanish meaning of the city name, the city is nicknamed City of Angels.
Geography
Location
The city center and suburbs of Los Angeles are located in a hilly coastal region on average 100 meters above sea level. To the west and south, the city borders the Santa Monica Bay of the Pacific Ocean. To the east and north, it is surrounded by mountain ranges. Also to the north of the city is the San Fernando Valley, where one-third of residents live in single-family homes. The valley is cut off from Hollywood and downtown by Griffith Park and the Santa Monica Mountains.
The administrative territory of the city has an area of 1290.6 km². Of this, 1214.9 km² is land area and 75.7 km² is water area. The urban area extends 71 km in a north-south direction and 47 km in an east-west direction. It is connected by a system of expressways made of steel and concrete structures. The city is burdened by the highest density of motor vehicles in the world, and automobile and industrial emissions have become a pressing environmental problem. As a result, Los Angeles is among the cities with the highest levels of smog pollution in the United States.
The city is sometimes called horizontal city, because it has relatively few skyscrapers and the entire urban area is very wide. Nevertheless, high land prices in the centre of Los Angeles mean that skyscrapers are now also becoming established there. The agglomeration, i.e. the continuously built-up area, covers an area of 4320 km².
There are various definitions of the Los Angeles metropolitan region:
- The Metropolitan Statistical Area (MSA) includes the 15 municipalities (districts) of Los Angeles and the two counties of Los Angeles (Metropolitan Division Los Angeles-Long Beach-Glendale) and Orange (Metropolitan Division Riverside-San Bernardino-Ontario). It has a land area of 12,562 km².
- The Combined Statistical Area (CSA) includes 173 independent cities. It includes the counties of Los Angeles, San Bernardino, Riverside, Ventura and Orange. The extended metropolitan region thus extends to the Nevada border and has an area of 87,941 km². Yet only a fraction of this area is used for urban development. The largest part consists of uninhabited parts, namely the Mojave Desert and the Joshua Tree National Park, which is located in Riverside and San Bernardino County.
Geology
The San Andreas Fault runs along the eastern edge of the metropolitan area; in addition, the Puente Hills Fault is located directly beneath the city. The resulting earthquake hazard explains the strict building codes applied throughout the Southern California seismic zone. Since 1800, Los Angeles has been hit by nine major earthquakes of magnitude six and higher and thousands of smaller quakes. Many buildings are built to withstand earthquakes, which significantly reduces the number of fatalities during quakes.
Until 1958, there was also a legal requirement that the upper limit for buildings could not exceed 45 metres or 14 storeys. The only exception was the town hall of 1928 with 138 meters. Earthquake-resistant constructions later made the law obsolete. The danger of earthquakes, the rejection of dense building and the definition of a model according to which Los Angeles was to become more of a kind of "City in the Garden" were the ideas behind this regulation. This is another explanation for the expansion of the city.
The most severe earthquake in recent history was the Fort Tejon earthquake on January 9, 1857, near the present-day communities of Wrightwood and Palmdale. The magnitude 7.9 quake caused little damage because the region was sparsely populated at the time. If such an earthquake were to occur today, the damage would amount to several billion US dollars and the loss of life would be considerable.
On March 10, 1933, the magnitude 6.4 Long Beach earthquake claimed 120 lives. Long Beach and other towns suffered property damage of US$ 50 million. Many of the damaged buildings were not built to withstand earthquakes. Another major earthquake occurred on February 9, 1971, with a magnitude of 6.6. The so-called San Fernando earthquake of 1971 (also known as the Sylmar earthquake) caused $500 million in damage in the San Fernando Valley and claimed 65 lives. The June 28, 1991 quake had a magnitude of 5.8 but did not cause a surface rupture because of its depth. It nevertheless caused US$ 40 million in damage, mainly in the San Gabriel Valley.
On January 17, 1994, a 6.7 magnitude earthquake struck the city of Los Angeles. The epicentre of the Northridge earthquake was in the Reseda district of the San Fernando Valley. 57 people were killed and 12,000 injured. Major transportation routes and an estimated 100,000 buildings were damaged or destroyed. According to the Federal Emergency Management Agency (FEMA), property damage amounted to US$ 40 billion.
In 2008, the U.S. Geological Survey (USGS) and the Southern California Earthquake Center published a new study. The researchers predicted a 99.7 percent probability of a major earthquake of magnitude 6.7 in California by 2038, with a 46 percent probability of a quake of magnitude 7.5 or greater. The Los Angeles metropolitan area is at slightly greater risk than San Francisco in the northern part of the state. Thus, the possibility of a magnitude 6.7 quake is 67 percent in Los Angeles and 63 percent in San Francisco.
An earthquake of magnitude 5.4 was recorded at 11:42 a.m. local time on July 29, 2008. The epicenter was located about 46 km east-southeast of the city center, near Chino Hills.
City breakdown
Los Angeles is divided into 15 counties (districts). The population figures refer to the census of April 1, 2000.
| Borough | Area | Inhabitants | Inhabitants per |
| 1st District | 36,17 | 236.344 | 6.534 |
| 2nd District | 130,64 | 258.603 | 1.980 |
| 3rd District | 107,54 | 258.788 | 2.406 |
| 4th District | 78,00 | 252.787 | 3.241 |
| 5th District | 122,72 | 258.749 | 4.106 |
| 6th District | 63,02 | 235.885 | 3.743 |
| 7th District | 78,09 | 235.869 | 3.020 |
| 8th District | 46,35 | 243.108 | 5.245 |
| 9th District | 38,09 | 236.932 | 6.220 |
| 10th District | 35,19 | 243.664 | 6.924 |
| 11th District | 167,68 | 258.433 | 1.541 |
| 12th District | 161,31 | 242.361 | 1.502 |
| 13th District | 34,01 | 244.369 | 7.185 |
| 14th District | 59,43 | 235.036 | 3.955 |
| 15th District | 99,74 | 253.884 | 2.545 |
| Los Angeles | 1.257,97 | 3.694.813 | 2.937 |
See also: List of Los Angeles neighborhoods and List of Los Angeles suburbs
Settlement form
The Los Angeles region is characterized by extreme urban sprawl. The entire city is broken up like a mosaic into a multitude of individual districts. The districts have different functions such as business districts or residential districts and are clearly differentiated from each other. The individual residential districts are home to population groups that also differ significantly in terms of origin, education, income or age structure. In some cases, the districts are isolated from one another, and not infrequently even sealed off by walls or fences. There is no dominant center in the entire city region. Downtown Los Angeles, although it has the only collection of skyscrapers in the huge sea of houses and also has a symbolic significance, is only one of many urban districts. Within the Los Angeles agglomeration, there are many districts with their own center, character and specialized functions, such as Long Beach, Santa Ana, Anaheim or Pasadena.
On the one hand, this diversification and fragmentation is a problem, but on the other hand, it can also be one of the reasons for the city's rise. Los Angeles is one of the most heterogeneous cities in the world, characterized by the individualism of its inhabitants. Different milieus and lifestyles coexist, making the urban space no longer recognizable as a cohesive unit. This is reflected in particular in the lack of a clearly recognizable center. Since the end of the 20th century, a number of new terms have been developed for these postmodernist forms of settlement, such as exopolis, postmetropolis, or the concept of the Zwischenstadt. Such cities are often also referred to as edgeless cities or edge cities, as suburban, posturban or even desurban spaces. The term urban-land hybrid is used in an attempt to account for the developments of postmodern forms of settlement - with a focus on Los Angeles. Such agglomerations represent a new type of spatial development "whose precondition is extensive suburbanization." The study of these developments was devoted, particularly in the late 1980s and 1990s, to the research group of the Los Angeles School of Urbanism.
Climate
The city is located in the subtropical climate zone. The average annual temperature is 18 degrees Celsius and the annual average rainfall is 305 millimeters. The warmest months are July and August with an average of 22.8 degrees Celsius and the coldest is January with an average of 13.2 degrees Celsius. Almost all the annual precipitation falls in the months of November to March, accordingly, it is mostly dry between May and October.
In summer, Los Angeles usually has temperatures around 22 to 25 degrees Celsius during the day. If not for its location on the Pacific coast, it would be even warmer, as the wind from the sea moderates the temperatures. Winter, on the other hand, is a bit colder, with temperatures almost never dropping below 15 degrees Celsius. At night, the temperature drops by an average of about ten degrees Celsius. The humidity is between 50 and 75 percent.
Typical for the climate in the Los Angeles region are also several, relatively clearly distinguishable smaller climate zones. This is mainly due to the various mountain ranges that separate the Los Angeles basin, for example, from the San Fernando Valley and other areas further inland. In the San Fernando Valley, for example, it is often several degrees warmer in summer than on the coast, while it is noticeably cooler there in winter.
Every two to three years there are heat waves in which temperatures can rise above 40 degrees Celsius. The reason for this are the so-called Santa Ana winds, which come over the Santa Ana Mountains from the deserts east of the city. This repeatedly causes extensive forest and brush fires. On October 3, 1933, 29 firefighters died in Griffith Park in one of the worst brush fires in the United States. Between late October and early November 1993, fires in the Los Angeles metropolitan area destroyed thousands of acres of developed land. The highest temperature was recorded on July 22, 2006 in Woodland Hills at 48.3 degrees Celsius, and the lowest temperature was recorded on February 6, 1989 in Canoga Park at -7.8 degrees Celsius.
| Los Angeles | ||||||||||||||||||||||||||||||||||||||||||||||||
| Climate diagram | ||||||||||||||||||||||||||||||||||||||||||||||||
| ||||||||||||||||||||||||||||||||||||||||||||||||
| Monthly average temperatures and precipitation for Los Angeles
Source: ; wetterkontor.de | ||||||||||||||||||||||||||||||||||||||||||||||||||||||||||||||||||||||||||||||||||||||||||||||||||||||||||||||||||||||||||||||||||||||||||||||||||||||||||||||||||||||||||||||||||||||||||||||||||||||||||||||||||||||||||||||||||||||||||||||||||||||||||||||||||||||||||||||||||||||||||
Environmental issues
Of concern is the high level of air pollution - high levels of ozone, nitrogen oxides and hydrocarbons - in Los Angeles, caused by local industry and automobile traffic. The Los Angeles/Long Beach/Riverside metropolitan area ranked among the most polluted urban areas in the United States in 2007, according to a report by the American Lung Association. In addition to industries and everyday traffic of private cars and trucks, a significant portion of the air pollution can be attributed to inland port traffic, i.e., trucks carrying goods between the wharf and the drop-off, often with their engines idling. The remedy is to be provided by electric heavy-duty trucks, which have been introduced since 2009.
Pollutant concentrations are highest especially in the morning and evening rush hour. Photochemical smog, whose main component is ozone, on the other hand, reaches its highest concentration at midday. As the city is surrounded by mountain ranges, air exchange with the wide surrounding area is inhibited. The sea breeze only reaches the Los Angeles basin without resolving the inversion weather pattern over the city.
Ozone and other chemicals cause coughing, eye irritation, headaches and lung dysfunction in the population. Since the early 1980s, efforts have been made to solve the problem. In 1979, for example, elevated levels of pollutants were measured on 120 days a year; in 1996 - after the introduction of catalytic converters - they were measured on only seven days. In the new millennium, the number of smog days has dropped to almost zero. Nevertheless, the Los Angeles metropolitan area still releases one of the nation's largest amounts of toxic gases into the atmosphere. The main reason is the poorly developed public transport system.
Air pollution in Los Angeles also threatens the more distant mountain lakes and snow-covered regions of the Sierra Nevada and is responsible for forest dieback. Strong winds carry the pollutants as far as Palm Springs in Riverside County, leading to increased concentrations of pollutants there.


Questions and answers
Q: What is the population of Los Angeles?
A: The population of Los Angeles is 3,847,400 people.
Q: How many people live in the Greater Los Angeles area?
A: Over 18 million people live in the Greater Los Angeles area.
Q: What is the size of Los Angeles?
A: The city has an area of 1,200 square kilometres (460 sq mi).
Q: When did Los Angeles overtake Chicago as the second largest city in the United States?
A: In the 1970s, Los Angeles overtook Chicago as the second largest city in the United States.
Q: What are some ethnic groups that can be found in Los Angeles?
A: Some ethnic groups found in Los Angles include Mexican, Japanese, Korean, Vietnamese, Salvadoran, Iranian and Armenian.
Q: Why does L.A have few skyscrapers and tall structures?
A: Due to being built on a fault line which runs through downtown L.A., it has few skyscrapers and tall structures.
Q: Is L.A known for its entertainment industry?
A Yes, L.A is known to be the entertainment capital of the world with many movies, television shows and fashion shows set there.
Related articles
Author
AlegsaOnline.com Los Angeles Leandro Alegsa
URL: https://en.alegsaonline.com/art/59308
Sources
- today.com : "Frey crafts a new view of modern-day Los Angeles"
- commons.wikimedia.org : Los Angeles
- wikidata.org : wikidata.org/wiki/Q65
- catalogue.bnf.fr : cb15238463r
- data.bnf.fr : (data)
- d-nb.info : 4036361-2
- id.loc.gov : n79021240
- musicbrainz.org : 1f40c6e1-47ba-4e35-996f-fe6ee5840e62
- catalog.archives.gov : 10046660
- id.ndl.go.jp : 00629461
- aleph.nkp.cz : ge134331
- viaf.org : 124053622
- worldcat.org : lccn-n79021240