Île-de-France
![]()
The title of this article is ambiguous. For other meanings, see Île-de-France (disambiguation).
The Île-de-France [il dəˈfʀɑ̃s] is a region in northern France, largely identical to the Paris metropolitan area and therefore also known as the Paris agglomeration. The region consists of the city of Paris (with classification number 75) and the departments of Essonne (91), Hauts-de-Seine (92), Seine-et-Marne (77), Seine-Saint-Denis (93), Val-d'Oise (95), Val-de-Marne (94) and Yvelines (78). It has an area of 12,012 km² and 12,326,429 inhabitants (as of January 2021). Major cities besides Paris, which is also the administrative seat of the region, are Versailles, Boulogne-Billancourt, Montreuil, Argenteuil and Saint-Denis. The inhabitants are called Franciliens. The department with the ordinal number 75 forms the core city, the departments 92, 93 and 94 form the Petite Couronne (1st inner suburban belt) and the departments 77, 78, 91 and 95 form the Grande Couronne (2nd outer suburban belt).
The name Île-de-France (Engl. Island of France) is today usually explained by the location between the rivers Seine, Marne, Oise and Beuvronne, by which the area is enclosed like an island. Possibly, however, the name also goes back to an old Frankish term Liddle Franke, i.e. "Little Franconia" or "Little France". As a zone d'études et d'aménagement du territoire and NUTS 1 region, it is now also called Région parisienne ("Paris Region").
The most common dialects in Île-de-France are Champenois and Francien.

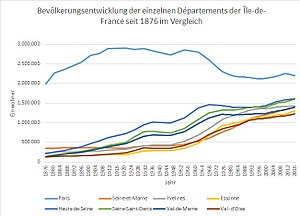
Comparison of population trends in the individual departments of Île-de-France 1876-2016

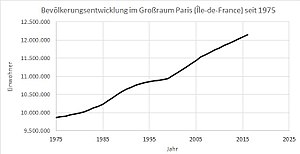
Population development 1975-2016

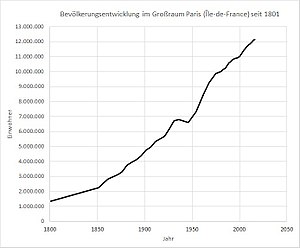
Population development 1801-2016
.svg.png)
The logo of the region (since 2005)

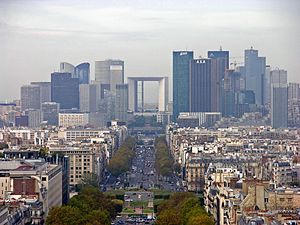
View from the Arc de Triomphe to La Défense
History
Historically, Île-de-France is the heartland of France, which was mostly referred to by names such as Francia or French. The standard French language is based on the dialect of Île-de-France.
Since the subjugation of Syagrius by Clovis I, the area has formed, with only a brief interruption in the 7th century, a political centre of the Frankish Empire of the Merovingians and Carolingians and, from the 9th century, of the West Frankish Empire, i.e. the later France. For centuries it was identical with the French crown domain, the Domaine royal. From here the Gothic style spread, which was originally the architectural style only of this region and thus also the French "royal style". From Louis XIV onwards, the French kings ruled from Versailles, where they created the imposing and much copied Palace of Versailles.
Until the French Revolution, Île-de-France was one of the historical provinces of France. With the formation of the départements in 1789/1790, it was dissolved as an administrative unit.
When the programme regions (Régions de programme) were formed in 1956, the area was initially given the name Région Parisienne. In 1976, the Région Parisienne was renamed Île-de-France. However, the territory of the new region differs significantly in some areas from that of the former province. Since 1986, Île-de-France, like the other regions, has had a directly elected regional council.
Population
Demographics
The population of 10,952,011 at the time of the 1999 census has increased to 12,326,429 by 2021, according to INSEE estimates, bringing the population density from 912 to 1026 inhabitants per km². Île-de-France is by far the most populous and densely populated region in France. In 2021, 18.9% of all inhabitants of European France lived in Île-de-France.
The majority of inhabitants live in the urban agglomeration (Unité urbaine) around Paris, which with 9,644,507 inhabitants (1999) is the largest in France and one of the largest in Europe. Only thirteen years later, in 2012, the population of the Unité urbaine was already 10,550,350 and in 2015 it was 10,706,072.
The Paris metropolitan region (Aire urbaine), which is relatively identical to the Île-de-France region, had 12,405,426 inhabitants in 2013 and 12,532,901 in 2015. In 2016, the number of inhabitants was already 12,568,755.
| Population trends in Île-de-France since 1801
|
According to a 2013 forecast, the population of Île-de-France is expected to increase by a further 1.1 million inhabitants between 2010 and 2030. In 2050, the population is even expected to exceed 15 million.
The following table shows the population trends in Île-de-France since 1876, broken down into its eight départements: the data refer to the current territorial status, which has remained unchanged since the 1968 territorial reform in Île-de-France.
On 1 January 1968, under a 1964 law, the departments of Seine and Seine-et-Oise were dissolved. The newly created department of Paris was given the number 75 of the former department of Seine. The department of Yvelines was given the number 78 of the former department of Seine-et-Oise. Three newly created departments were given the numbers of the former Algerian departments of Alger, Oran and Constantine: Essonne was given 91, Hauts-de-Seine 92, Seine-Saint-Denis 93. New numbers were given to the departments of Val-de-Marne with 94 and Val-d'Oise with 95. The department of Seine was divided into the four new departments of Paris (consisting only of the city of Paris), Hauts-de-Seine, Seine-Saint-Denis and Val-de-Marne. The latter three departments also include some communes that were previously part of the department of Seine-et-Oise. The department of Seine-et-Oise was divided into three new departments: Yvelines, Essonne and Val-d'Oise. Only the department of Seine-et-Marne, with the order number 77, remained untouched by the territorial reform.
As can be seen in the following table, at the beginning of the 20th century, the population increase took place mainly in Paris and the Petite Couronne. Since the 1930s, the population of Paris has been declining, due to the severe overpopulation with a population density of about 30,000 inhabitants per km² for the city of Paris in the 1920s. Paris was considered the most densely populated city of millions in Europe. Furthermore, the population density decreased due to the modernization of apartments and mergers of small apartments (Paris has a very old building stock). The reduction of the average household size, the emergence of offices and the better accessibility of the center through the increasingly better developed public transport and newly built highways into the banlieues, also contributed to this development.
After decades of population declines, Paris experienced population growth again between 1997 and 2011. Since 2012, however, the number of inhabitants has been declining again.
Since the 1960s, population growth in Petite Couronne has stagnated, before returning to growth in the late 1990s, a growth that continues to this day.
While until the 1950s, population growth was mainly in Paris and the Petite Couronne, and the Grande Couronne grew at a slower rate, this changed in the 1950s, where since then in the Grande Couronne, population growth has continued to this day. The Grande Couronne grew particularly strongly in the 1960s and 1970s with the creation of large housing estates and huge new housing developments and the expansion of the villes nouvelles, all of which are located in the Grande Couronne.
Today, the Petite Couronne is almost completely urbanized and has a very high population density, with averages of 5,000 to 9,000 inhabitants per km², depending on the département. Paris is still the most densely populated metropolis in Europe, with over 20,000 inhabitants per km². The Grande Couronne also has a high population density for area départements, with the areas bordering the Petite Couronne having a high degree of urbanisation and the cities having grown seamlessly together with the cities of the Petite Couronne and these in turn seamlessly together with Paris.
Today, all seven suburban departments of Île-de-France are growing in terms of population, with Petite Couronne (due to its proximity and accessibility to the city centre and lower prices than in Paris) and Seine-et-Marne (due to the many new housing developments) currently experiencing the strongest growth. In all the departments of Île-de-France, population growth is due solely to a surplus of births. This amounts to about 110,000 persons per year (with about 180,000 births and 70,000 deaths per year in Île-de-France). With the exception of the department of Seine-et-Marne, all the departments of Île-de-France have a negative migration balance. This amounts to about -50,000 people per year. As a result, the region is growing by around 60,000 people per year, which corresponds to an annual increase of 0.5%, exactly in line with the national average.
Since the mid-1970s, the Île-de-France region has been experiencing a loss of migration compared to the rest of France. Until then, the region had been able to record large migration gains. The reasons for the loss of migration are the high price level, the housing shortage, the city hustle and bustle and the desire for more living space, which can only be fulfilled in the countryside due to the high prices. Especially in the age group of the over 50s, the region is recording high migration losses, which is due to the fact that many retire to the countryside or settle in the south of France because of the nicer weather.
It remains to be seen how the planned increase in the number of newly built apartments per year in Île-de-France from the current 40,000 to 70,000 as part of the Le Grand Paris project will affect population development.
| Detailed population trends by department in Île-de-France since 1876
| |||||||||||||||||||||||||||||||||||||||||||||||||||||||||||||||||||||||||||||||||||||||||||||||||||||||||||||||||||||||||||||||||||||||||||||||||||||||||||||||||||||||||||||||||||||||||||||||||||||||||||||||||||||||||||||||||||||||||||||||||||||||||||||||||||||||||||||||||||||||||||||||||||||||||||||||||||||||||||||||||||||||||||||||||||||||||||||||||||||||||||||||||||||||||||||||||||||||||||||||||||||||||||||||||||||||||||||||||||||||||||||||||||||||||||||||||||||||||||||||||||||||||||||||||||||||||||||||||||||||||||||||||||||||||||||||||||||||||||||||||||||||||||||||||||||||||||||||||||||||||||||||||||||||||||||||||||||||||||||||||||||||||||||||||||
Cities
The most populous cities in Île-de-France are:
| City | Inhabitants (year) | Département |
| Paris | 2.175.601 (2018) | Paris |
| Boulogne-Billancourt | 121.334 (2018) | Hauts-de-Seine |
| Saint-Denis | 112.091 (2018) | Seine-Saint-Denis |
| Argenteuil | 110.213 (2018) | Val-d'Oise |
| Montreuil | 109.914 (2018) | Seine-Saint-Denis |
| Nanterre | 96.807 (2018) | Hauts-de-Seine |
| Vitry-sur-Seine | 94.649 (2018) | Val-de-Marne |
| Créteil | 92.265 (2018) | Val-de-Marne |
| Aubervilliers | 87.572 (2018) | Seine-Saint-Denis |
| Aulnay-sous-Bois | 86.278 (2018) | Seine-Saint-Denis |
| Colombes | 86.052 (2018) | Hauts-de-Seine |
| Asnières-sur-Seine | 85.946 (2018) | Hauts-de-Seine |
| Versailles | 85.205 (2018) | Yvelines |
| Courbevoie | 82.198 (2018) | Hauts-de-Seine |
| Rueil-Malmaison | 77.986 (2018) | Hauts-de-Seine |
| Champigny-sur-Marne | 77.039 (2018) | Val-de-Marne |
| Saint-Maur-des-Fossés | 75.298 (2018) | Val-de-Marne |
In total, Île-de-France has 130 towns with more than 25,000 inhabitants, 39 of which have more than 50,000 inhabitants (as of 1 January 2012).
Search within the encyclopedia