Household income in the United States
Definition and measurement of household income in the U.S., its components, historical trends, uses in policy and research, distributional patterns, and limitations of the measure.
Household income in the United States is a commonly used statistical measure of the total pre-tax cash income received by all members of a household. Official agencies and many researchers aggregate the money receipts of household residents above a minimum age to describe economic well‑being, to set program eligibility, and to study distributional change over time. The term emphasizes the combined resources that support people who share housing and often expenses, though it does not imply legal or familial relationships among residents.
Image gallery
10 Images


What is included and how it is measured
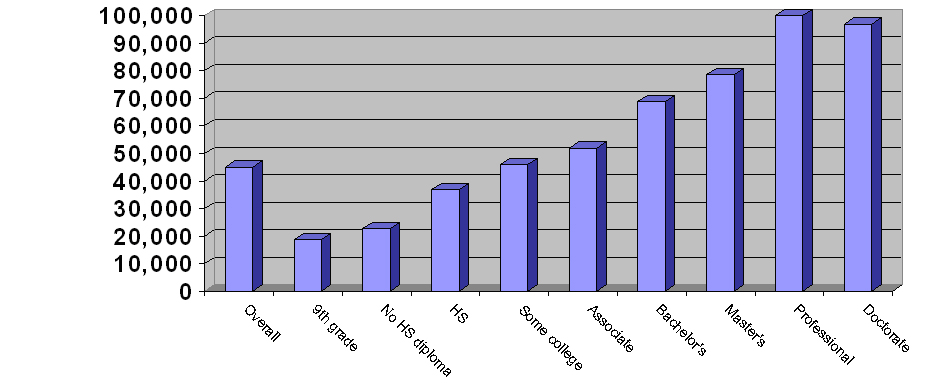
Household income generally counts earnings from work (wages and salaries), self‑employment receipts, interest and dividend income, rental income, and government transfer payments such as unemployment insurance, Social Security, disability benefits, and child support. The measure is typically reported before income taxes and excludes many noncash benefits like public housing subsidies and employer‑provided health insurance. National surveys define the exact age threshold and which kinds of receipts are tallied; for example, some historical surveys combined income from household members aged 15 and older. The U.S. Census Bureau and other agencies publish headline figures such as the median and mean household income and breakouts by quintiles, regions, and demographic groups. For background on official definitions and data releases see the U.S. Census and related resources: U.S. Census Bureau.
Typical statistics and distributional patterns
Practitioners often emphasize the median household income as a robust central tendency less affected by extreme high values than the mean. Median household income reports and quintile cutoffs provide a sense of how resources are spread across the population. Historical snapshots show that median household income in the mid‑2000s was in the low tens of thousands of dollars per year; for example, a commonly cited figure for 2005 is a median around $46,000. Analysts also examine the share of households above particular thresholds (for example, six‑figure incomes) and the proportion below the federal poverty line. Comparison of household income to per‑capita or personal income highlights how household size and the number of earners influence aggregate living standards. For additional context on measures and comparisons, consult explanatory material from data producers: Definitions and methodology.
Historical trends and drivers
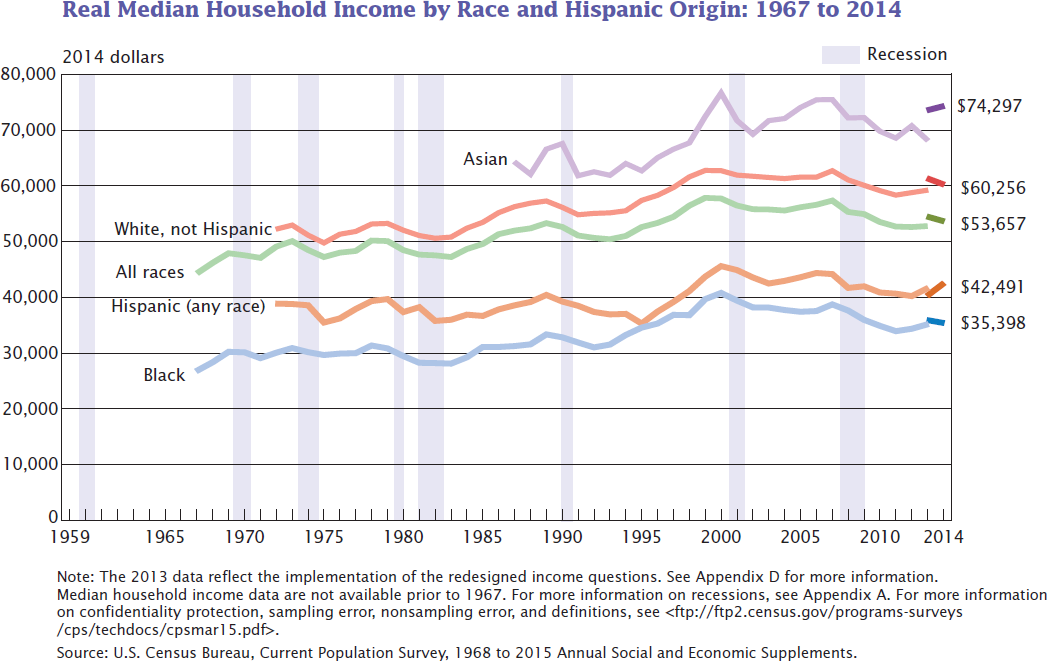
Over recent decades, household income has been shaped by labor‑market changes, demographic shifts, and policy. Key factors include the rise in dual‑earner households, changing hours and earnings for different occupations, and the long‑term growth of capital income for higher earners. These dynamics produced mixed outcomes: while nominal median household income rose since the late 20th century, inflation adjustments sometimes show slower real gains for many families. Periods of stagnation and recovery have been documented over overlapping intervals; for example, analysts have noted relative stagnation in the early 2000s followed by modest increases later in the decade. Unemployment and labor force participation trends also alter the number of income earners per household, which in turn changes the typical household income profile: see labor market indicators for more on that relationship: labor market data.
Uses, importance, and common applications
Household income is widely used by policymakers, social scientists, and private-sector actors. It helps determine eligibility for means‑tested programs, guides the allocation of benefits, informs tax policy debates, and is a key input for market research, lending criteria, and business planning. Economists also use household income to track inequality, analyze mobility, and evaluate the effects of shocks such as recessions. Because it captures combined financial resources available to people sharing a residence, it can be a more policy‑relevant indicator than individual earnings when assessing consumption capacity and housing affordability.
Limitations, distinctions, and cautions
Despite its wide use, household income has important limitations. It does not account for differences in household size or needs without further adjustment: two households with the same total income but different numbers of members have very different per‑person resources. Geographic cost‑of‑living variation means that identical incomes translate into different standards of living across cities and states. Household income also masks within‑household inequality (for example, disparities in control over resources) and ignores noncash support. Because high incomes can strongly influence the mean, analysts often prefer medians or percentile shares to summarize central and tail behavior. Alternative measures—such as disposable income after taxes and transfers, equivalized income per person, and consumption—complement household income to give a fuller picture of well‑being and inequality. For international comparisons and broader context, consult comparative sources on developed economies: comparative income studies.
Summary
Household income is a central but imperfect indicator of economic status in the United States. It aggregates pre‑tax cash receipts of household residents to describe resources available for living expenses and to support public and private decision making. Careful interpretation requires attention to household composition, regional price differences, and the choice between median and mean values. When combined with other measures—poverty thresholds, per‑capita income, and consumption—it remains a powerful tool for understanding economic conditions and guiding policy.
Questions and answers
Q: What is the median annual household income in the United States?
A: The median annual household income in the United States according to the US Census Bureau was determined to be $46,326 in 2005.
Q: How much did households in the top quintile earn?
A: Households in the top quintile had incomes exceeding $91,705.
Q: What percentage of all households had an annual income over $100,000?
A: 17.23% of all households had an annual income over $100,000.
Q: How many households were there in the United States in 2005?
A: There were approximately 113,146,000 households in the United States in 2005.
Q: What was the median number of income earners for those with lower incomes?
A: The median number of income earners for those with lower incomes was determined to be zero due to high unemployment among this group.
Q: What was the median household income according to US Census Bureau data from 1990?
A: The median household income according to US Census Bureau data from 1990 was determined to be $30,056; $44,603 in 2003 dollars.
Q: Has personal or household income increased since 1990 when adjusted for inflation?
A: Personal income has remained relatively stagnant since over the past few decades while household income has risen due to a rising percentage of households with two or more earners; however overall both have decreased very slightly when considering inflation.
Related articles
Author
AlegsaOnline.com Household income in the United States Leandro Alegsa
URL: https://en.alegsaonline.com/art/45358
Sources
- sccommunityprofiles.org : "Definition of household income"
- census.gov : "US Census Bureau news release in regards to median income"
- www12.statcan.ca : "Canada Census, Median Household income"
- pubdb3.census.gov : "US Census Bureau median income per household member"
- pubdb3.census.gov : "US Census 2005 Economic Survey, income data"
- census.gov : "US Census Bureau press release regarding poverty"
- pubdb3.census.gov : "US Census Bureau, income quintiles, 2006"
- usatoday.com : "USAToday, the definition of middle class income"
- demographia.com : "US Census Bureau, Median household income 1990"
- nytimes.com : "New York Times definition of class according to the quintiles"
- pubdb3.census.gov : "US Census Bureau, income quintilea and Top 5 Percent, 2004"
- factfinder.census.gov : "US Census Bureau, 2000 Census racial data"