Graz — capital of Styria, Austria
Graz is Austria’s second-largest city, capital of Styria, known for a well-preserved medieval centre, a lively university scene, modern architecture and a mix of industry, research and culture.
Overview
Graz is the principal city of the Austrian state of Styria and the country’s second-largest urban centre after Vienna. It lies on the river Mur and combines a historic core with contemporary neighbourhoods. The city is part of Austria’s cultural and economic network and serves as a regional hub for education, industry and the arts.
Image gallery
10 Images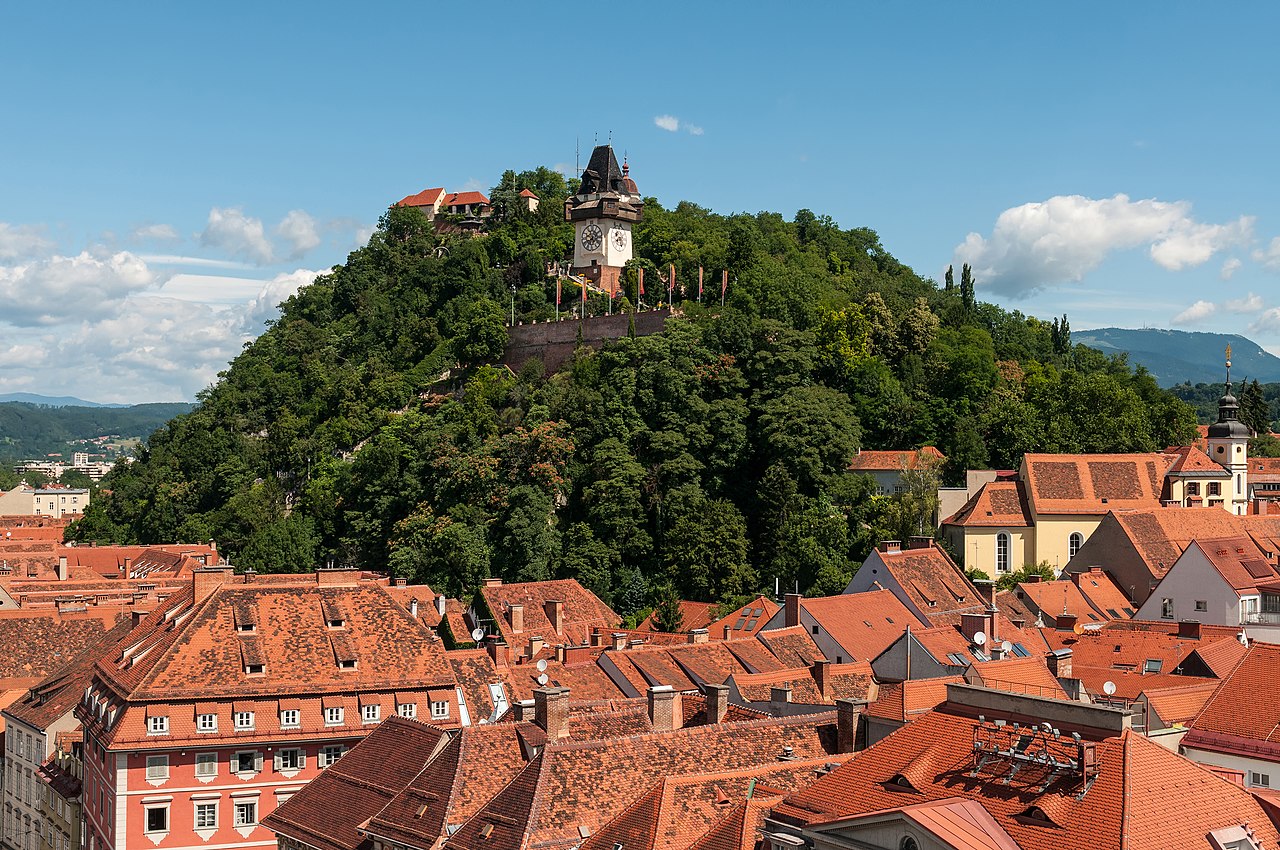


Geography and urban character
The historic centre is built around the Schlossberg, a wooded hill with a landmark clock tower, while newer districts spread across both banks of the Mur. Graz balances medieval streets and baroque façades with striking modern buildings and public spaces. The urban area includes residential boroughs, industrial zones and research parks.
History and development
Graz developed from a medieval market town into a principal Habsburg city and later a center for manufacturing and trade. Its compact old town retains many original buildings and streets, leading to international recognition for architectural preservation and urban continuity. Over time the city evolved into a center for higher education and technical research.
Culture, education and economy
Graz has a significant student population and a variety of higher-education institutions; see local universities and research centres. Education, advanced manufacturing, technology firms and creative industries are important economic drivers. Cultural life includes museums, theatres, festivals and contemporary art venues.
Landmarks and attractions
- Historic Old Town and Schlossberg with its clock tower
- Kunsthaus Graz (contemporary art museum) and the modern Murinsel
- Eggenberg Palace and several historic churches
Transport and notable facts
Graz is well connected by rail, road and a regional airport, functioning as a transport and service centre for southern Austria. Its historic centre is internationally regarded for preservation and urban quality. The combination of heritage, active university life and modern design makes Graz a notable European city for visitors and residents alike.
Geography
Location and city structure
General
Graz is located about 150 km southwest of Vienna, on both sides of the Mur River, where it ends its break through the Graz Hills and enters the Graz Basin. The city almost completely fills the northern part of the Graz Basin from west to east and is enclosed on three sides by mountains that tower up to 400 m above the built-up area. To the south, the urban area opens up into the Graz field.
The highest point in Graz is the Plabutsch at 754 m above sea level in the northwest of the city, the lowest point, at about 330 m above sea level. is located where the Mur river leaves the city in the south. Within Graz there are two prominent elevations, the Schloßberg with the clearly visible clock tower, and the Austein with the Kalvarienberg.
The nearest city of supra-regional importance is Maribor (Maribor on the Drava) in Slovenia, located about 60 km south of Graz. The two cities are linked by increasingly close cultural and economic ties. The Graz-Maribor European Region is one example of this.
Counties
→ Main article: List of the city districts of Graz
| Structure
| ||||||
| Legend for the structure table
|
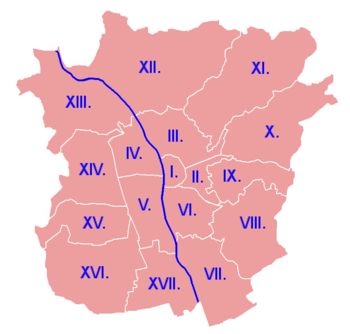
The urban area of Graz is divided into 17 districts. Around the first district, the Innere Stadt (I.), St. Leonhard (II.), Geidorf (III.), Lend (IV.), Gries (V.) and Jakomini (VI.) are situated in a counter-clockwise direction. Apart from the old town, five of the six core districts have grown historically.
Inner-city centres from which growth emanated were Murplatz, today Südtiroler Platz in the former Murvorstadt, Jakominiplatz, the formerly independent suburb of Geidorf, which had formed around the Leechkirche, and Guntarn-Hof, a historic courtyard on the site of the Leonhardkirche, which is considered to be the second settlement area in Graz. In the Murvorstadt, the districts of Gries around Griesplatz and Lend around Lendplatz developed.
The remaining districts form the outer ring of Graz: Liebenau, St. Peter, Waltendorf, Ries, Mariatrost, Andritz, Gösting, Eggenberg, Wetzelsdorf, Straßgang and Puntigam. The entire outer ring of suburban municipalities was transformed into city districts in 1938. This led to the formation of "Groß-Graz" and a resulting increase in population; Puntigam was split off from Straßgang in 1988.
Cadastral communities
Graz is divided into 28 cadastral municipalities: The districts of Innere Stadt, St. Leonhard, Geidorf, Lend, Gries, Jakomini, Wetzelsdorf, Gösting and Waltendorf each form a cadastral municipality.
Some outer districts consist of cadastral municipalities that are not congruent with the respective district. These are Engelsdorf, Messendorf (partly), Thondorf, Liebenau, Murfeld and Neudorf in Liebenau; Stifting and Ragnitz in Ries; Wenisbuch and Fölling in Mariatrost; Andritz, St. Veit ob Graz and Weinitzen in Andritz; Algersdorf and Baierdorf in Eggenberg; Straßgang (partly) and Webling (partly) in Straßgang; and Gries (partly), Rudersdorf, Straßgang (partly) and Webling (partly) in Puntigam.
In some cadastral community names the reference to the old, village structure has been preserved. Three examples: Algersdorf was an independent village outside the urban area, like Thondorf in today's Liebenau or Wenisbuch in Mariatrost. Other villages and localities such as St. Johann or Kroisbach in the Mariatrost district, which formed a closed settlement nucleus before incorporation, are not listed as cadastral municipalities.
Neighboring communities
Graz is surrounded by the political district of Graz Umgebung, in which all neighbouring municipalities are located:
| Gratkorn, | Stattegg | Weinitzen, |
| Thal |
| Hart near Graz |
| Hitzendorf, Seiersberg-Pirka | Feldkirchen near Graz | Gössendorf, |

Climate
Graz is located in the Illyrian climate zone. Its location on the south-eastern edge of the Alps provides good protection from the westerly weather conditions prevailing in Central Europe. Larger amounts of precipitation therefore mainly penetrate from the Mediterranean area.
The average temperatures are 8.7 °C at Graz-Thalerhof Airport and 9.4 °C at Graz University. The average annual precipitation results in a total amount of 818.9 mm with an average of 92.1 precipitation days (measuring point University of Graz).
The protected location results in a mild climate, so that in the parks and on the Schlossberg, plant species flourish that are otherwise only found in southern Europe. The Mediterranean influence is reflected in more than 2100 hours of sunshine per year and an average July temperature of 21 °C over a ten-year period. The basin location has climatic disadvantages, especially in the winter months: In winter, an inversion weather situation occasionally develops, which impedes air exchange in the Graz basin and can lead to exceedances of the permitted limit value for particulate matter. Graz was awarded the title of Climate Innovation City in 2021.
| Graz 1994-2013 | ||||||||||||||||||||||||||||||||||||||||||||||||
| Climate diagram | ||||||||||||||||||||||||||||||||||||||||||||||||
| ||||||||||||||||||||||||||||||||||||||||||||||||
| Monthly average temperatures and precipitation for Graz 1994-2013
Source: Sunshine duration: Precipitation: Temperature: | |||||||||||||||||||||||||||||||||||||||||||||||||||||||||||||||||||||||||||||||||||||||||||||||||||||||||||||||||||||||||||||||||||||||||||||||||||||||||||||||||||||||||||||||||||||||||||||||||||||||||||||||||||||||||||||||||||||||||||||
Geology
The mountainous country north of Graz on both sides of the narrow Murtal is geologically divided into two parts: Immediately south of the Längstalfurche of Mur- and Mürztal are the last eastern foothills of the central alpine chains, the gently rounded mountains of the Stub-, Glein- and Koralpe to the west and the Fischbacher Alps to the east of the Murquertal, which runs south from Bruck an der Mur as a through valley. South of this and immediately north of the Graz basin is the actual Graz mountain area, which consists mainly of limestone and shows ancient karst phenomena with the Lurgrotte and other caves. Embedded in this limestone zone is, for example, the crystalline island of St. Radegund. The central alpine foothills of crystalline schists accompanying the Mur-Mürz-Längstalfurche belong to the Middle East Alpine Unit (MOA).
In the entire Graz mountain region, former Paleozoic sediments and volcanic rocks predominate, which became metamorphic rocks during the Variscan and Alpine mountain building under several kilobars of pressure and several hundred degrees Celsius. Thus fossiliferous limestones became fossil-free marble, sandy-clay sediments became mica schist or paragneiss, and a basic volcanite became amphibolite.
Hydrology
The Mur river flows through the urban area of Graz. In addition to this, there are a number of flowing waters. See list of flowing waters in Graz.


Population
Population development
| Figures according to statistik.at | ||||||||||||||||||||||||||||||||||||||||||||||||||||||||||||||||||||||||
|
| |||||||||||||||||||||||||||||||||||||||||||||||||||||||||||||||||||||||
| Figures according to the city | ||||||||||||||||||||||||||||||||||||||
|
| Adjacent data can be found in the chart in the Forecast section directly below here. | ||||||||||||||||||||||||||||||||||||
The population of Graz exceeded the 100,000 mark around 1870, during the so-called Gründerzeit. Subsequently, the number of inhabitants rose steadily until the 1970s - partly through natural increase and immigration, partly through the incorporation of neighbouring towns in 1938 after the Anschluss of Austria by the National Socialists. From the end of the 1970s until 2001, the number decreased again, as many Graz residents moved to the surrounding communities.
Although the number of residents with their main residence decreased during these years, there was a simultaneous increase in the number of residents with a secondary residence and since 2001 an increase in the number of residents with their main residence. In addition, there are younger working people living in Graz who have their main residence with their parents outside Graz. This poses financial problems for Graz, as the city has to provide the infrastructure for all people living in and around Graz, but only receives money from the federal government for those with their main residence. On the other hand, the business location and the construction industry benefit from the mostly younger people who have their secondary residence in Graz. Graz is thus the fastest growing city in Austria. There are about 110,000 households with a share of women of 52 percent.
On 1 January 2021, 294,236 people had their main residence in Graz. Including secondary residences, there are 331,264 inhabitants. The figures do not include the 298 registered homeless people in the city.
Forecast
| Source: | ||||||||||||||||||||||||||||||||||||||||
|
| |||||||||||||||||||||||||||||||||||||||
Population structure by gender, age and nationality
On January 1, 2021 were:
- 50.64 % of the women in Graz,
- 16.23 % of Graz residents under 20 years of age,
- 68.72% between 20 and 65,
- 15.04 % over 65 years old.
219,738 of the people (74.68%) with main residence in Graz are Austrian citizens, 37,226 other EU citizens (12.65%) and 37,272 non-EU citizens (12.67%). Of the non-EU citizens, 2,959 come from Africa, 1,760 from North or South America, 16,740 from Asia, 104 from Australia and Oceania, 2,330 from Russia and a total of 25,356 from non-EU countries in Europe. 728 Graz residents are stateless.
On 1 January 2021, at least 500 people from each of the following countries were living in Graz: Romania (10,267), Croatia (9,320), Germany (8,984), Bosnia and Herzegovina (7,386), Turkey (5,581), Hungary (4,683), Slovenia (3,245), Afghanistan (2,995), Syria (2,748), Italy (2,612), Russia (2,330), Kosovo (1,869), Serbia (1.791), Slovakia (1,746), Bulgaria (1,122), Poland (1,084), Nigeria (922), Iran (919), People's Republic and Republic of China (Taiwan) (911), Macedonia (830), Egypt (824), Spain (812), Iraq (692), France (655), Greece (639), India (629), Ukraine (591), United Kingdom (560), United States (553).


Related articles
Author
AlegsaOnline.com Graz — capital of Styria, Austria Leandro Alegsa
URL: https://en.alegsaonline.com/art/40439
Sources
- statistik.at : "Dauersiedlungsraum der Gemeinden Politischen Bezirke und Bundesländer - Gebietsstand 1.1.2018"
- www1.graz.at : www1.graz.at
- graz.at : "A short history of Graz"
- whc.unesco.org : "City of Graz – Historic Centre and Schloss Eggenberg"