Global warming
![]()
This article is about man-made global warming since industrialization; for climate change in general, see climate change; for related political opposition, see climate change denial.
Current global warming or global warming (colloquially also "climate change") is the increase in the average temperature of the Earth's near atmosphere and oceans since the beginning of industrialization. It is an anthropogenic (= man-made) climate change, as it is mainly due to activities of the energy, agriculture, forestry, industry, transport and building sectors, which emit greenhouse gases.
In contrast to the weather, which describes short-term current conditions of the atmosphere, mean values are collected over long periods of time with regard to the climate. Usually, normal periods of 30 years are considered. According to the Intergovernmental Panel on Climate Change (IPCC), the temperature increase since pre-industrial times up to 2017 was about 1 °C. With minimal temperature differences, 2020 and 2016 were the two warmest years since systematic measurements began in 1880. 2016 was about 1.1 °C warmer than in pre-industrial times. According to current research, it was last this warm at the end of the Eemian warm period 115,000 years ago. The 20 years measured as warmest are in the last 22 years (as of 2018), and the five warmest years, in descending order, were 2016, 2019, 2015, 2017, and 2018.
The rate of warming has accelerated: The rate of increase calculated over the years 1956 to 2005 was 0.13 ± 0.03 °C per decade, almost double the rate calculated over the years 1906 to 2005.According to the IPCC, human-induced global warming had reached 1 °C in 2017, when the rate of increase was about 0.2 °C per decade. The warming has been occurring considerably faster than any known warming period in the Earth's modern era, i.e., for 66 million years. Thus, during the transition from an ice age to an interglacial period, the Earth warms by about 4 to 5 °C within about 10,000 years. In the case of man-made global warming, without more stringent climate protection measures, the temperature is expected to rise by 4 to 5 °C from the end of the 20th to the end of the 21st century; the warming would therefore be about 100 times faster than in the case of historical natural climate changes.
The cause of warming is the ongoing anthropogenic enrichment of the earth's atmosphere with greenhouse gases, in particular carbon dioxide (CO2), methane and nitrous oxide, which are released primarily through the combustion of fossil energy, deforestation, and agriculture and especially livestock farming. This increases the retention capacity for infrared heat radiation in the troposphere, which intensifies the greenhouse effect. The most important greenhouse gas in the current global warming is CO2. In 2015, the average CO2 concentration in the Earth's atmosphere measured by the Mauna Loa monitoring station rose above 400 ppm for the first time; before industrialization, it had been around 280 ppm. The IPCC wrote in its 2015 Fifth Assessment Report that it is extremely likely that humans caused more than 50% of the warming observed from 1951 to 2010. The best estimate is that the human contribution to warming during this period is about 100%. These values are supported by other state of the art reports. Without the current human influence on the climate system, the slight cooling trend that has prevailed for several millennia would very likely continue.
The atmospheric greenhouse effect was first described by Joseph Fourier in 1824; there was further research starting in the 1850s. In 1896, the chemist and physicist Svante Arrhenius predicted global warming due to the amounts of CO2 emitted by humans. In 1938, Guy Stewart Callendar succeeded in proving global warming for the first time based on temperature measurements. After World War II, the topic increasingly became the focus of scientific attention. In 1957, the researchers Roger Revelle and Hans E. Suess spoke of a giant (large-scale) "geophysical experiment." Beginning around the 1960s, discussions took place at the international level on the topic of anthropogenic climate change. Nathaniel Rich, in his 2019 book Losing Earth, detailed how much was known about global warming and its consequences as early as the 1980s. Since about the early 1990s, there has been a scientific consensus that the global warming measured since about 1850 is caused by humans.
According to climate research, the expected consequences of global warming, some of which have already been observed, include, depending on the region of the earth: sea ice and glacier melt, a rise in sea level, the thawing of permafrost soils with the release of methane hydrate, growing drought zones and increasing weather extremes with corresponding repercussions on the living and survival situation of humans and animals (species extinction). The extent of the consequences depends on the level and duration of warming. Some consequences may be irreversible and also act as tipping elements in the Earth system, which in turn accelerate global warming through positive feedback, such as the release of the greenhouse gas methane from thawing permafrost soils.
In order to mitigate the consequences of global warming for humans and the environment, national and international climate policy aims both to limit climate change through climate protection and to adapt to the warming that has already occurred. In order to halt man-made global warming, further energy-related greenhouse gas emissions must be completely avoided and the emissions introduced into the atmosphere since the beginning of industrialization, as well as emissions that cannot be avoided from now on due to negative greenhouse gas emissions, must be completely reversed using suitable technologies such as BECCS, DACCS or carbon sequestration in the soil. As of 2016, about 2⁄3 of the CO2 budget of the maximum possible emissions for the two-degree target agreed to in the Paris Agreement had already been used up, so global emissions will have to be reduced quickly if the target is still to be met. It is possible that the two-degree target is not ambitious enough to prevent, in the long term, a state of the climate system known as Greenhouse Earth, which would lead to hostile conditions on Earth.
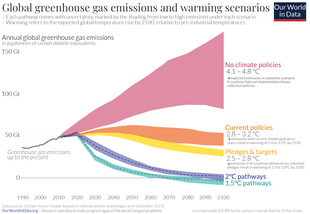
Possible future scenarios of global greenhouse gas emissions. If all countries meet their current pledges set out in the Paris Agreement, average warming by 2100 will far exceed the Paris Agreement target of keeping warming "well below 2 ° C."
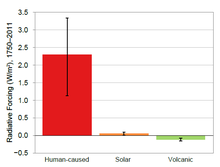
Causes of global warming (1750-2011) (as of 2018).
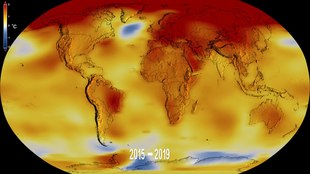
Play media file Local surface temperatures since 1880, moving averaged over five years and with a spatial resolution of about 1200 km.
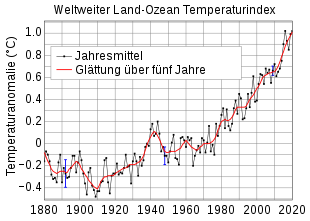
Land-ocean temperature index from 1880 to present, with reference period 1951-1980. The solid black line is the annual global mean and the solid red line is the five-year locally weighted scatterplot smoothing. The blue uncertainty bars represent the total annual uncertainty at a 95% confidence interval.
Causes of man-made global warming
The global warming currently observed is due virtually entirely to human activities. The probable human contribution to the warming of the period 1951 to 2010 is at least 93% and could be as high as 123%, i.e., more than 100%, which is possible by offsetting various cooling factors. The main cause is the increasing concentration of greenhouse gases in the Earth's atmosphere due to human activities. In the Fifth Assessment Report of the IPCC, the resulting additional radiative forcing in 2011 compared to the reference year 1750 is quantified as 2.3 W/m² net (i.e. after deduction of also cooling effects, for example by aerosols). Grossly, all long-lived greenhouse gases caused a radiative forcing of 2.83 W/m². The most important greenhouse gas was CO2 with 1.82 W/m², followed by methane with 0.48 W/m². Halogenated hydrocarbons caused a radiative forcing of 0.36 W/m², nitrous oxide 0.17 W/m². Of the short-lived greenhouse gases, ozone, whose formation is stimulated by nitrogen oxides, carbon monoxide or hydrocarbons, has the highest radiative forcing with 0.4 W/m². Aerosols cause a negative (i.e. cooling) radiative forcing of -0.9 W/m².
In contrast, changes in natural solar activity are an insignificant factor in the currently observed global warming. During the same period, solar activity accounted for a radiative forcing of only 0.1 W/m²; since the middle of the 20th century, solar activity has even decreased.
Concentration increase of the most important greenhouse gases
→ Main article: Greenhouse gas
The proportion of all four components of the natural greenhouse effect in the atmosphere has increased since the beginning of the Industrial Revolution. The rate of increase in concentration is the fastest in the last 22,000 years.
The concentration of CO2 in the Earth's atmosphere has increased by 40% from about 280 ppmV to about 400 ppmV (parts per million, parts per million volume fraction) in 2015, mainly due to the use of fossil energy, the cement industry and large-scale deforestation since the beginning of industrialization. During the last 14 million years (since the Middle Miocene), no significantly higher CO2 levels existed than at present. According to measurements from ice cores, CO2 concentrations have never exceeded 300 ppmV over the past 800,000 years. Approximately 100 million tons of carbon dioxide are released into the atmosphere per day by human activities (as of 2020).
The volume fraction of methane increased from 730 ppbV in 1750 to 1,800 ppbV (parts per billion, volume fraction) in 2011. This is a 150% increase and, as with CO2, the highest level in at least 800,000 years. Livestock is currently considered the main cause of this, followed by other agricultural activities such as rice cultivation. The global warming potential of 1 kg of methane is 25 times higher than that of 1 kg of CO2 over a period of 100 years. According to a recent study, this factor is as high as 33 when interactions with atmospheric aerosols are taken into account. However, in an oxygenated atmosphere, methane is oxidized, mostly by hydroxyl radicals. Once a methane molecule has entered the atmosphere, it has an average residence time there of twelve years.
In contrast, the residence time of CO2 is sometimes in the range of centuries. The oceans absorb atmospheric CO2 very quickly: A CO2 molecule is dissolved in the oceans after an average of five years. However, the oceans also release it back into the atmosphere, so that part of the CO2 emitted by humans ultimately remains in the carbon cycle of the hydrosphere and atmosphere for several centuries (approx. 30 %) and another part (approx. 20 %) even for millennia.
The volume fraction of nitrous oxide increased from pre-industrial 270 ppbV to 323 ppbV in the meantime. Through its absorption spectrum, it contributes to closing a radiation window otherwise open to space. Despite its very low concentration in the atmosphere, it contributes about 6% to the anthropogenic greenhouse effect, since its effect as a greenhouse gas is 298 times stronger than that of CO2; in addition, it also has a rather high atmospheric residence time of 114 years.
The water vapor concentration of the atmosphere is not significantly changed by anthropogenic water vapor emissions, since additional water introduced into the atmosphere condenses out within a few days. However, rising global average temperatures lead to a higher vapor pressure, i.e. greater evaporation. The resulting global increase in the water vapor content of the atmosphere additionally drives global warming. Water vapor thus essentially acts as a feedback loop. Along with the ice-albedo feedback, this water vapor feedback is the strongest, positively acting feedback in the global climate process.
Aerosols
In addition to greenhouse gases, aerosols also influence the Earth's climate, but with an overall cooling effect. Aerosols provide the largest uncertainty of all observed contributions to radiative forcing. The effect of an aerosol on air temperature depends on its altitude in the atmosphere. In the lowest atmospheric layer, the troposphere, soot particles provide a temperature increase as they absorb sunlight and subsequently emit thermal radiation. The reduced reflectivity (albedo) of snow and ice surfaces and soot particles subsequently deposited on them also have a warming effect. In higher air layers, on the other hand, mineral particles ensure that it is cooler at the earth's surface due to their shielding effect.
A major uncertainty factor in the assessment of the climate impact of aerosols is their influence on cloud formation, which is also not fully understood. Overall, aerosols are thought to have a significant cooling effect. Decreasing air pollution could therefore contribute to global warming.
An intermittent decline or stagnation in global average temperature is largely attributed to the cooling effect of sulfate aerosols, which were located in Europe and the United States between the 1940s and mid-1970s, and in the People's Republic of China and India after 2000.
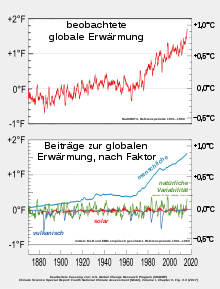
Evolution of Earth surface temperature (top) and individual factors affecting climate since 1870: solar activity, volcanism, natural variability (e.g., El Niño/La Niña years), and human activities (greenhouse gas emissions and cooling aerosol emissions).
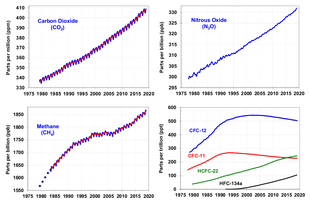
Carbon dioxide, nitrous oxide, methane, and CFCs/PFCs (only the latter are decreasing due to global efforts to protect the ozone layer ).

Increase in atmospheric carbon dioxide concentration in the Holocene.
_720p_HD_50FPS.webm.jpg)
Play media file Effect of CO2 on the climate (Terra X)
Measured and projected heating
The main indications for the current global warming are the worldwide temperature measurements available since about 1850 as well as the evaluations of various climate archives. Compared with the fluctuations of the seasons as well as with the change of day and night, the numbers mentioned in the following seem small; as a global change of the climate, however, they mean a lot, if one considers the average temperature on earth during the last ice age, which was only about 6 K lower.
In 2005, based on the measured temperature increase of the oceans over a decade, it was calculated that the Earth absorbs 0.85 watts per square meter more power than it radiates into space.
Temperature increase so far
According to a publication released in 2016, the average global temperature began to rise as early as 1830 due to human activities. This was found as part of a broad study in which a large number of globally distributed, paleoclimatological indicators of past times (so-called climate proxies) were evaluated. At that time there was no dense network of temperature measuring stations. A distinct warming phase was observed between 1910 and 1945, during which natural fluctuations also had a significant influence due to the still comparatively low concentration of greenhouse gases. The most pronounced warming, however, occurred from 1975 to the present.
2016 was the warmest year since measurements began in 1880. It was about 1.1 °C warmer than in pre-industrial times. 2017 was the warmest non-El Niño year to date and also the second warmest year since measurements began. Since the 1980s, every decade has been warmer than the previous one; the five warmest years, in descending order, were 2016, 2019, 2015, 2017, and 2018. According to figures from the Copernicus program, warming was as much as 1.3 °C above pre-industrial levels, at times nearly reaching the policy-targeted limit of 1.5 °C. Compared to 2015, the additional warming has amounted to 0.2 °C.
Between 1880 and 2012, globally averaged near-surface air temperatures increased by 0.85 °C. Particularly in the case of short time series, it must be taken into account that the start and end years can have a strong influence on the trend and thus do not necessarily reflect long-term trends. An example of such a deviation is the period between 1998 and 2012, which began with a strong El Niño and thus exceptionally hot year, which is why the warming trend of 0.05 °C per decade in this period was well below the long-term trend of 0.12 °C per decade in the period 1951 to 2012. Nevertheless, the 30 years from 1983 to 2012 in the northern hemisphere were the warmest normal period in 1400 years. In this context, a study published in 2020, based on a detailed analysis of paleoclimate data, concludes that the warming that has occurred in the 21st century so far is very likely to exceed the temperature levels of the Holocene Climate Optimum (about 8000 to 6000 years ago).
A study published in 2007 narrowed the natural portion of 20th century warming to less than 0.2 K.
Ocean warming
→ Main article: Heat content of the oceans
In addition to the air, the oceans have also warmed; they have absorbed over 90% of the additional heat energy. While the oceans heated up by only 0.04 K overall from 1955 to the mid-2000s due to their enormous volume and large temperature inertia, their surface temperature increased by 0.6 K over the same period. In the range from the ocean surface to a depth of 75 meters, the temperature increased by an average of 0.11 K per decade from 1971 to 2010.
The energy content of the oceans increased by about 14.5 × 10²² joules between the mid-1950s and 1998, which corresponds to a heating power of 0.2 watts per m² of the Earth's total surface. This amount of energy would warm the lower 10 kilometers of the atmosphere by 22 K. Over the period 1971 and 2016, the averaged heat uptake of the oceans was about 200 terawatts, more than 10 times the complete world energy consumption of humanity.
Since 2000, the heat content of the oceans has been measured with the help of the Argo program, which has made considerably more precise data on the state as well as the change of climatologically relevant measured values (e.g. heat content, salinity, depth profile) available since then. The last ten years have been the warmest years for the oceans since measurements began; 2019 the warmest to date.
Local and temporal distribution of observed warming
Air over land surfaces generally warms more than over water surfaces, which can be seen in the animation at the beginning of this article (third position at the top right). The warming of land surfaces between 1970 and 2014 averaged 0.26 K per decade, twice as much as over the sea, which warmed 0.13 K per decade over the same period. Because of this difference in rapid warming between land and sea, many regions on land have already warmed by more than 1.5 degrees Celsius. At the same time, temperatures in the northern hemisphere, where the majority of land areas are located, have risen more sharply than in the southern hemisphere over the past 100 years, as the accompanying graph also shows.
Nighttime and winter temperatures increased somewhat more than daytime and summer temperatures. Broken down by season, the greatest warming was measured during the winter months, and particularly strong over western North America, Scandinavia and Siberia. In spring, temperatures increased most in Europe and in northern and eastern Asia. In the summer, Europe and North Africa were most affected, and in the fall, the largest increases were over northern North America, Greenland, and East Asia. Warming was particularly striking in the Arctic, where the annual average is about twice the global average. With the exception of a few regions, the warming has been detectable worldwide since 1979.
For the different air layers of the earth's atmosphere, a different warming is theoretically expected and factually also measured. While the Earth's surface and the low to middle troposphere should warm, models suggest cooling for the higher stratosphere. In fact, this exact pattern has been found in measurements. Satellite data show a decrease in lower stratospheric temperature of 0.314 K per decade over the past 30 years. This cooling is caused partly by the enhanced greenhouse effect and partly by ozone depletion due to CFCs in the stratosphere, see also Montreal Protocol for the Protection of the Ozone Layer. If the sun were the decisive cause, the near-surface layers, the low to middle troposphere as well as the stratosphere should have warmed up. According to the current understanding, this means that the majority of the observed warming must be caused by human activities.
The ten warmest years since 1880
The following table shows the ten warmest years in the period from 1880 to 2020 - deviation from the long-term average temperature (1901-2000) in °C
|
| ||||||||||||||||||||||||||||||||||||||||||||||||||||||||||||||||||||||||
Temporary cooling or pause in global warming
→ Main article: Global warming pause
Even assuming a warming of 4 K by the end of the 21st century, there will always be phases of stagnation or even cooling in the course of time. These phases can last up to about 15 years. Causes are the eleven-year sunspot cycle, cooling strong volcanic eruptions as well as the natural property of the world climate to show an oscillating temperature pattern (AMO, PDO, ENSO). For example, the occurrence of El Niño or La Niña events can raise or lower the global average temperature by 0.2 K from one year to the next, masking the annual warming trend of about 0.02 K for a few years, but also amplifying it.
Feedback
The global climate system is characterized by feedbacks that amplify or attenuate temperature changes. A feedback that amplifies the cause is called a positive feedback. At certain states of the global climate system, according to current knowledge, the positive feedbacks are significantly stronger than the negative feedbacks, so that the climate system can tip over into another state.
The two strongest, positively acting feedback processes are the ice-albedo feedback and the water vapor feedback. A melting of the polar ice caps causes an additional energy input via the ice-albedo feedback due to reduced reflection. The water vapor feedback results from the fact that the atmosphere contains more water vapor at higher temperatures. Since water vapor is by far the most powerful greenhouse gas, this further amplifies a warming process that has been initiated - regardless of what ultimately triggered that warming. The same is true in the case of cooling, which is further amplified by the same processes. The term climate sensitivity has been established to quantitatively describe the response of the climate to changes in the radiation balance. It can be used to compare different influencing variables with each other.
Another positive feedback is provided by CO2 itself. With increasing global warming, the water in the oceans also becomes warmer and can thus absorb less CO2. As a result, more CO2 can enter the atmosphere, which can further intensify the greenhouse effect. At present, however, the oceans still absorb around 2 Gt of carbon per year (equivalent to around 7.3 Gt of CO2) more than they release into the atmosphere over the same period, see ocean acidification.
However, in addition to these three physically well-understood feedbacks, there are other feedback factors whose effects are much more difficult to estimate, particularly with respect to clouds, vegetation, and soil.
Importance of clouds for the climate
Clouds significantly influence the Earth's climate by reflecting part of the incident radiation. Radiation coming from the sun is reflected back into space, radiation from underlying atmospheric layers towards the ground. The brightness of clouds comes from short-wave radiation in the visible wavelength range.
A greater optical thickness of low clouds causes more energy to be radiated back into space; the temperature of the Earth decreases. Conversely, less dense clouds allow more solar radiation to pass through, which warms layers of the atmosphere below. Low clouds are often dense and reflect much sunlight back into space. Because temperatures are higher in deep layers of the atmosphere, clouds therefore radiate more heat. The tendency of low clouds is therefore to cool the Earth.
High clouds are usually thin and not very reflective. They let through most of the sunlight, so they only reduce solar radiation somewhat, but at night they reflect some of the heat radiation from the earth's surface, reducing nighttime cooling somewhat. Because they are very high, where the air temperature is very low, these clouds do not radiate much heat. The tendency of high clouds is to warm the earth a little at night.
Vegetation and the condition of the soil, and in particular its sealing, deforestation or agricultural use, have a significant influence on evaporation and thus on cloud formation and the climate. A reduction in cloud formation by plants has also been demonstrated: these emit up to 15 percent less water vapor in the event of a CO2 increase; this in turn reduces cloud formation.
Overall, cloud feedbacks are likely to amplify global warming. A simulation published in 2019 suggests that when CO2 concentrations exceed 1,200 ppm, stratocumulus clouds could break up into scattered clouds, further driving global warming.
Influence of vegetation and soil
Vegetation and soil reflect incident sunlight differently depending on their nature. Reflected sunlight is reflected back into space as short-wave solar radiation (otherwise the Earth's surface would be black from the perspective of space without an infrared camera). The albedo is a measure of the reflectivity of diffusely reflecting (reemitting), i.e. non-reflecting and non-self-illuminating surfaces.
| Surfaces | Albedo in % |
| Settlements | 15 to 20 |
| Tropical rainforest | 10 to 12 |
| Deciduous forest | 12 to 15 |
| Cultivated areas | 15 till 30 |
| Grassland | 12 till 30 |
| Arable land | 15 till 30 |
| Sandy soil | 15 till 40 |
| Dune Sand | 30 to 60 |
| Glacial ice | 30 to 75 |
| Asphalt | 15 |
| Clouds | 60 to 90 |
| Water | 5 to 22 |
It is not only the consumption of fossil fuels that leads to the release of greenhouse gases. The intensive cultivation of arable land and deforestation are also significant sources of greenhouse gases. Vegetation requires CO2 for the process of photosynthesis to grow. Soil is an important sink because it contains organic carbonaceous material. Agricultural activities such as plowing release this stored carbon more readily in the form of CO2 because more oxygen can enter the soil and the organic material decomposes more quickly. It is likely that as temperatures rise, the release of methane from wetlands increases; there is still uncertainty (as of 2013) about the amount of release.
In the permafrost of Western Siberia, 70 billion tons of methane are stored; in oceans, even much larger quantities have been deposited on continental slopes in the form of methane hydrate. Local climate changes (currently: +3 K within 40 years in Western Siberia) could cause critical regional temperatures to be reached even with low global warming; there is a risk of the methane stored there being released into the atmosphere.
A calculation assuming such feedbacks was made by scientists at the University of California, Berkeley, who assumed that the CO2 content of the atmosphere will increase from the current level of about 390 ppmV to about 550 ppmV by 2100. This, they said, is solely the anthropogenic increase caused by humanity. Increased temperature leads to additional release of greenhouse gases, particularly CO2 and methane. As temperature rises, there is an increased release of CO2 from the world's oceans and accelerated decay of biomass, which releases additional methane and CO2. This feedback could cause global warming to be 2 K greater than was assumed in 2006. For this and other reasons, Barrie Pittock estimates in Eos, the publication of the American Geophysical Union, that future warming could exceed the ranges cited by the IPCC. He cites eight reasons for his guess, including declines in global dimming and feedback effects from biomass, among others.
Projected heating
With a doubling of the CO2 concentration in the atmosphere, climate researchers assume that the increase in the Earth's mean temperature will be within 1.5 to 4.5 K. This value is also known as the climate sensitivity. This value is also known as climate sensitivity and is related to the pre-industrial level (of 1750), as is the radiative forcing that determines it; this quantity is used by the IPCC to quantitatively describe all known factors that influence the Earth's radiation balance and make them comparable. According to the 5th Assessment Report, the IPCC expects the global average temperature to increase by 1.0 to 3.7 K by the year 2100 (based on 1986-2005 and depending on the GHG emission pathway and the climate model applied). By comparison, the fastest warming over the course of the last ice age to the current warm period was a warming of about one degree per 1000 years.
According to a study at the Carnegie Institution for Science that evaluated the results of a carbon cycle model with data from intercomparison studies between climate models in the IPCC's fifth Assessment Report, the global climate system responds to a CO2 input with a time lag of about 10 years with a jump function; that is, warming reaches its maximum after about 10 years and then remains there for very long periods.
The Climate Action Tracker indicates the most likely global warming expected by the end of this century. According to this, the world is currently (2021) on track to warm by 2.4 °C or 2.9 °C compared to the pre-industrial global average temperature. To calculate this value, the voluntary commitments of the major emitters to reduce greenhouse gas emissions are fed into a climate model.
Long-term view and resulting consequences
According to a study published in 2009, the warming that has already been triggered at present will still be irreversible for at least 1,000 years, even if all greenhouse gas emissions were completely stopped today. In further scenarios, emissions were gradually continued until the end of our century and then also abruptly stopped. In the process, key assumptions and statements made in the 4th IPCC report about the following 1000 years were confirmed and refined. Long-term climate simulations indicate that the Earth, heated by an increased carbon dioxide concentration, will cool by only about one degree per 12,000 years.
In contrast, a complete burning of fossil energy resources, conservatively estimated at 5 trillion tons of carbon, would lead to a global temperature increase of about 6.4 to 9.5 °C, with very strong negative impacts on ecosystems, human health, agriculture, the economy, and so on. If unconventional resources were burned in addition to conventional ones, the carbon dioxide concentration in the Earth's atmosphere could rise to about 5000 ppm by the year 2400. In addition to an enormous temperature increase, the Antarctic ice sheet would almost completely melt, which would raise the sea level by approx. 58 m even without including the Greenland ice sheet.
Projections 2050
In 2019, the Crowther Lab, based at ETH Zurich, forecast temperatures in 520 metropolitan areas around the world for 2050, with 22% of the cities predicted to have climatic conditions not currently found in any city in the world. The others are predicted to have conditions equivalent to another city currently. Vienna, for example, is predicted to have a climate similar to Skopje, Hamburg to San Marino, Berlin and Paris to Canberra in Australia, London to Melbourne, Athens and Madrid to Fez in Morocco, Nairobi to have a climate similar to Maputo. New York should get a climate like Virginia Beach, Virginia Beach again like Podgorica, Seattle like San Francisco, Toronto like Washington D.C., Washington D.C. like Nashville.
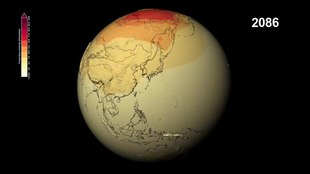
Play media file The NASA video (English, German subtitles) shows temperature and precipitation simulations for the 21st century. It is based on the four representative concentration pathways (RCPs) of the 5th IPCC Assessment Report with the increase of CO₂ levels in the air to 421 ppm (RCP 2.6), 538 ppm (RCP 4.5), 670 ppm (RCP 6.0) and 936 ppm (RCP 8.5) in 2100. The colors show the evolution of temperatures compared to the average values in the period 1971 to 2000.
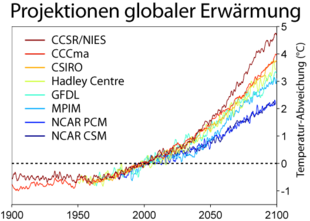
Projections of temperature development until 2100
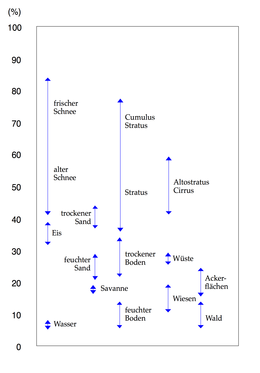
Percent of reflected sunlight as a function of different earth surface conditions.
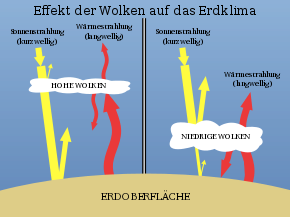
Low clouds cool the earth by their solar reflection, high clouds warm the earth
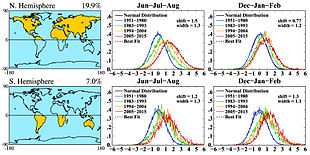
Observed shift in frequency distribution: plotted is the distribution of measured temperature data from 2005-2015 compared to the normal period 1951-1980, after Hansen and Sato 2016.
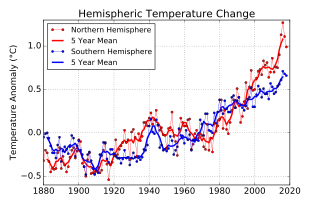
The northern hemisphere (red) warmed somewhat more than the southern hemisphere (blue); the reason for this is the greater proportion of land area in the northern hemisphere, which heats up faster than oceans.
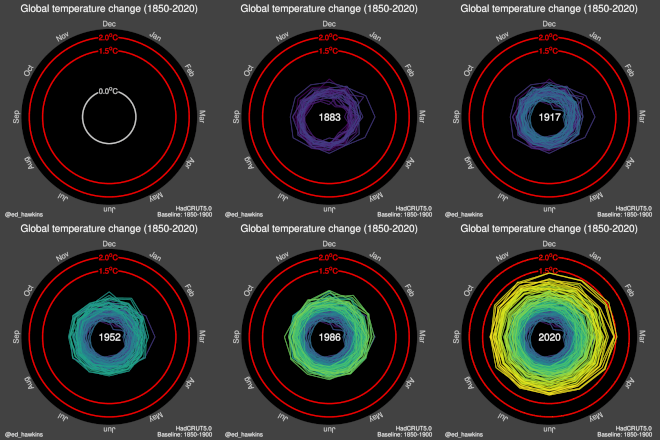
Global monthly temperatures since 1850, animation from Met Office HadCRUT4 data.
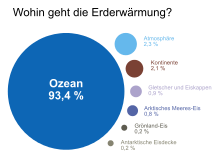
The graph shows where the additional energy that accumulates in the Earth system as a result of anthropogenic disruption of the climate remains
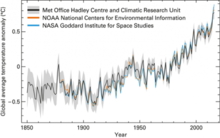
Global average temperature anomaly 1850-2016
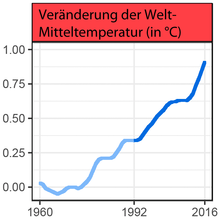
Evolution of temperature increase according to "World Scientists' Warning to Humanity: A Second Notice", 2017.
State of Research
History of Science
→ Main article: Climatology
→ Main article: History of climate change research
In 1824, Jean Baptiste Joseph Fourier discovered the greenhouse effect. Eunice Newton Foote was the first to experimentally investigate the effect of solar radiation on airtight glass tubes filled with various gases. She demonstrated the absorption of thermal radiation by carbon dioxide and water vapor, recognized this as a possible cause of climate change events, and published her results in 1856. This did not become known until 2010. In 1859, John Tyndall succeeded in concretely demonstrating the absorption by greenhouse gases of long-wave infrared radiation emanating from the Earth's surface; he determined the relative importance of water vapor versus carbon dioxide and methane for the natural greenhouse effect. Following Tyndall, Svante Arrhenius published the hypothesis in 1896 that anthropogenic CO2 enrichment in the atmosphere could increase the Earth's temperature. This was the beginning of the "science of global warming" in the narrower sense.
In 1908, the British meteorologist and later president of the Royal Meteorological Society Ernest Gold (1881-1976) published a paper on the stratosphere. In it, he wrote that the temperature of the tropopause rises with increasing CO2 concentration. This is a characteristic of global warming that could also be measured almost a century later.
In the late 1950s, it was first demonstrated that the carbon dioxide content of the atmosphere was increasing. On the initiative of Roger Revelle, Charles David Keeling started regular measurements of the CO2 content of the atmosphere (Keeling curve) on Mount Mauna Loa (Hawaii, Big Island) in 1958. Gilbert Plass was the first to use computers and considerably more accurate absorption spectra of CO2 to calculate expected warming in 1956. He obtained 3.6 K (3.6 °C) as the value for climate sensitivity.
The first computer programs to model the world's climate were written in the late 1960s.
In 1979, the U.S. National Academy of Sciences wrote in the "Charney Report" that an increase in carbon dioxide concentration was undoubtedly linked to significant climate warming; however, significant effects were not expected for several decades due to the inertia of the climate system.
U.S. climatologist James E. Hansen told the U.S. Senate Energy and Natural Resources Committee on June 23, 1988, that he was 99 percent convinced that the respective annual record temperatures were not the result of natural variations. This is considered the first such statement by a scientist before a political body. Already in this meeting, demands were made for political measures to slow down global warming. In November 1988, the Intergovernmental Panel on Climate Change (IPCC) was established to assist policymakers and governments. The IPCC discusses and coordinates scientific findings on global warming and the anthropogenic contribution to it, and summarizes them in reports.
Anthropogenic global warming in the context of the earth's history
→ Main article: Paleoclimatology
Since its inception, research into the causes and consequences of global warming has been closely linked to the analysis of the climatic conditions of past times. Svante Arrhenius, who was the first to point out that humans are warming the earth through the emission of CO2, recognized the climatic influence of changing concentrations of carbon dioxide in the earth's atmosphere when searching for the causes of the ice ages.
Just like earthquakes and volcanic eruptions, climate change is something natural. The Earth's climate has been changing constantly since its formation, and it will continue to change in the future. Primarily responsible for this has been a changing concentration and composition of greenhouse gases in the atmosphere due to the varying intensity of volcanism and erosion. Other factors affecting climate include variable solar irradiance, due in part to Milanković cycles, and permanent reshaping and shifting of continents caused by plate tectonics. Land masses at the poles promoted the formation of ice caps, and changing ocean currents directed heat either away from or toward the poles, thus influencing the strength of the very powerful ice-albedo feedback.
Although the luminosity and radiant power of the sun at the beginning of Earth's history were about 30 percent lower than today, conditions prevailed throughout that time under which liquid water could exist. This phenomenon (paradox of the weak young sun) led in the 1980s to the hypothesis of a "CO2 thermostat": It kept the temperatures of the earth constant over billions of years in ranges where life on earth was possible. When volcanoes emitted more CO2, causing temperatures to rise, the degree of weathering increased, trapping more CO2. If the Earth was cold and the concentration of the greenhouse gas was low, weathering was greatly reduced by the glaciation of wider areas of land. The greenhouse gas, which continued to flow into the atmosphere as a result of volcanism, accumulated there to a certain tipping point and then caused a global thaw. The disadvantage of this mechanism is that it takes several millennia to correct for greenhouse gas concentrations and temperatures, and several cases are known where it failed.
It is assumed that the great oxygen catastrophe 2.3 billion years ago caused a collapse of the methane concentration in the atmosphere. This reduced the greenhouse effect so much that it resulted in a large-scale and long-lasting glaciation of the Earth during the Huron Ice Age. In the course of - presumably several - Snowball Earth events during the Neoproterozoic, about 750 to 635 million years ago, the Earth's surface again froze almost completely.
The last such event occurred just before the Cambrian explosion 640 million years ago and is called the Marino Ice Age. The bright surface of the almost completely frozen Earth reflected almost all of the incident solar energy back into space, thus keeping the Earth trapped in a state of ice age; this did not change until the concentration of carbon dioxide in the Earth's atmosphere had risen to extremely high levels due to volcanism continuing under the ice. Because the CO2 thermostat responds sluggishly to change, the Earth not only thawed, but subsequently plunged into the other extreme of a super greenhouse for several decades. The extent of the glaciation is disputed among scientists, however, because climate data from this period are inaccurate and incomplete. According to recent research, a similar constellation occurred at the Carboniferous-Permian transition about 300 million years ago, when atmospheric carbon dioxide concentrations decreased to a minimum of probably 100 ppm. This brought the Earth's climate system into the immediate vicinity of that tipping point that would have sent the planet into a climate state of global glaciation.
In contrast, at the time of probably the greatest mass extinction 252 million years ago, the Earth was a super greenhouse with much higher temperatures than today. This drastic temperature increase, which wiped out almost all life on Earth at the Permian-Triassic boundary, was very likely caused by a long period of intense volcanic activity, which led to the formation of the Siberian trap. Recent isotopic studies indicate that the oceans of that time warmed by as much as 8 K within a relatively short period of time and, in parallel, became highly acidic. During these and other periods of extremely high temperatures, the oceans were largely devoid of oxygen. Such oceanic anoxic events were repeated several times in Earth's history. It is now known that both periods of severe cooling, such as during the Grande Coupure, and rapid warmings were accompanied by mass extinctions. The paleontologist Peter Ward even claims that all known mass extinctions in Earth's history, with the exception of the KT impact, were triggered by climate crises.
The climate of the last 10,000 years was unusually stable compared to the frequent and strong fluctuations of the preceding millennia. This stability is considered a basic requirement for the development and continuation of human civilization. Most recently, rapid and strong global warming occurred during the Paleocene/Eocene Thermal Maximum and the Eocene Thermal Maximum 2, caused by a massive input of carbon (CO2 and/or methane) into the atmosphere. These epochs are therefore the subject of intensive research to gain insights into the possible effects of ongoing human-induced warming.
The current climate change and the climate change expected for the coming years may have the magnitude of major climate changes in the history of the Earth, but the predicted coming temperature change is at least a factor of 20 faster than in all global climate changes of the last 65 million years. If we look at the speed of warming phases from ice ages to interglacials, as occurred five times in the last 500,000 years or so, phases of rapid warming occurred there in each case. These phases lasted about 10,000 years each and were characterized by a rise of about 4 to 5 °C in total. In the case of the current man-made warming, the increase, without significant climate protection measures, was also calculated at about 4 to 5 °C - only that this process takes place in 100 instead of 10,000 years.
Based on the soon to be two hundred years of data and research, it can be assumed that the Pliocene epoch can be an analogous example for the near future of our planet. The carbon dioxide content of the atmosphere in the middle Pliocene was determined by Δ13C isotopic analysis and was then in the range of 400 ppm, corresponding to the concentration of 2015. Using climate proxies, temperature and sea level of the period 5 million years ago can be reconstructed. At the beginning of the Pliocene, the global average temperature was 2 K higher than in the Holocene; the global annual average temperature responds very sluggishly to changes in radiative forcing due to the enormous heat capacity of the world's oceans, and so it has only increased by about 1 K since the beginning of the Industrial Revolution.
Among other things, warming leads to a rise in sea level. Sea level in the middle of the Pliocene was about 20 meters higher than today.
Intergovernmental Panel on Climate Change (IPCC)
→ Main article: Intergovernmental Panel on Climate Change
The Intergovernmental Panel on Climate Change (IPCC) was established in 1988 by the United Nations Environment Programme (UNEP) together with the World Meteorological Organization (WMO) and is attached to the Framework Convention on Climate Change, which was concluded in 1992. For its reports, which are published at intervals of about six years, the IPCC summarizes the worldwide research results in the field of climate change and thus represents the current state of knowledge in climatology.
The organization was awarded the Nobel Peace Prize in 2007, together with former US Vice President Al Gore. The Fifth Assessment Report was published in September 2013.

The Intergovernmental Panel on Climate Change (IPCC) summarizes the state of scientific knowledge about global warming every few years
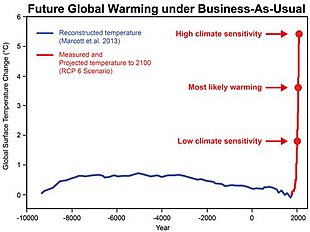
Global increase in average temperatures over the past 10,000 years since the Neolithic Revolution and the temperature increase expected by the end of the 21st century for three different assumptions on climate sensitivity under unabated emissions ("business as usual" scenario).
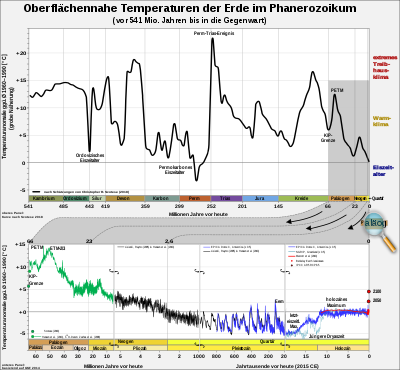
Clickable reconstructed temperature curve of the Phanerozoic. The values for 2050 and 2100 are based on the 5th Assessment Report of the IPCC assuming a continuously increasing CO2 concentration. - The graph illustrates how strongly the global temperature has fluctuated over the course of Earth's history, whereby it has been almost consistently lower than today for the last 2.6 million years.
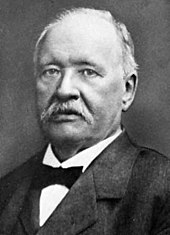
Svante Arrhenius, one of the pioneers in the history of global warming science
Adaptation Strategies
→ Main article: Adaptation to global warming
Parallel to preventive climate protection in the form of avoidance strategies, adaptations to impacts of man-made climate change that have already occurred or can be expected in the future are necessary: The negative consequences associated with global warming are to be mitigated as far as possible and made as compatible as possible; at the same time, the use of regionally possibly positive consequences is examined. Adaptive capacity varies depending on a wide range of parameters, including existing knowledge of local climate change or, for example, the level of development and economic performance of a country or society. Overall, especially in socio-economic terms, the capacity to adapt is strongly shaped by vulnerability. The Intergovernmental Panel on Climate Change (IPCC) lists the least advanced "developing countries" among the countries and regions with particularly high vulnerability.
Adaptation to the consequences of global warming has primarily short- to medium-term effects. However, since the adaptive capacity of societies is limited and strong global warming can undo adaptation measures already taken, adaptation cannot be an alternative to preventive climate protection, but only a complement to it.
Potential adaptation measures range from purely technological measures (e.g., coastal protection) to behavioral changes (e.g., dietary behavior, choice of vacation destinations) and managerial decisions (e.g., changes in land management) to political decisions (e.g., planning regulations, emission reduction targets). Given that climate change impacts many sectors of an economy, integrating adaptation into, for example, national development plans, poverty reduction strategies, or sectoral planning processes is a key challenge; many countries have therefore developed adaptation strategies.
In the United Nations Framework Convention on Climate Change (UNFCCC), which was adopted in 1992 and has since been ratified by 192 countries, the issue of adaptation played hardly any role compared to the prevention of dangerous climate change (Article 2 of the UNFCCC). This is similarly true for the Kyoto Protocol, which was agreed in 1997 and entered into force in 2005, but the decision was taken there in principle to set up a special UN adaptation fund ("Adaptation Fund") to help the particularly affected developing countries finance adaptation measures. The United Nations Green Climate Fund, which was established during the 2010 climate conference in Cancún, is also intended to contribute to this. Industrialized nations provide money for the fund so that developing countries can better adapt to climate change.
At the latest with the 3rd Assessment Report of the IPCC, published in 2001, the understanding of the need for adaptation strategies has increased. With regard to scientific support for governments, the Nairobi Work Program on Adaptation and Vulnerability adopted in 2006 was a particularly important step.
See also
![]()
Portal: Climate change - Overview of Wikipedia content on global warming
- Anthropocene
- Global environmental change and future scenarios
- List of the largest greenhouse gas emitters
- List of countries by temperature
- Oceanic anoxic event
- Social science research on climate change
Questions and Answers
Q: What is global warming?
A: Global warming is the current rise in temperature of the air and oceans caused by humans burning coal, oil, and natural gas; and cutting down forests.
Q: How much has the average temperature risen since 1750?
A: The average temperature today is about 1°C (1.8°F) higher than before people started burning a lot of coal around 1750.
Q: What are the main causes of global warming?
A: The present global warming is mostly because of people burning things like gasoline for cars and natural gas to keep houses warm, as well as carbon dioxide from these activities being released into the atmosphere. Animals which produce methane also contribute to global warming.
Q: Who predicted that carbon dioxide would cause global warming?
A: Svante Arrhenius predicted this more than a hundred years ago, confirming the work of Joseph Fourier 200 years ago.
Q: What can be done to reduce global warming?
A: To reduce global warming people could burn less fossil fuels, grow more trees, eat less meat, and put some carbon dioxide back in the ground. People could also adapt to some temperature change.
Q: What did governments agree on in terms of limiting temperatures rises in the Paris Agreement?
A: In the Paris Agreement almost all governments agreed to keep temperature rise below 2°C (3.6°F).
Q: Are current plans enough to limit global warming according to climate scientists?
A: No, current plans are not enough to limit global warming that much according to most climate scientists.
Search within the encyclopedia