
Econometrics: Quantitative Analysis of Economic Relationships
Econometrics applies statistical and mathematical techniques to measure, test, and forecast relationships among economic variables. It links theory and data for estimation, policy evaluation, and prediction.
Overview
Econometrics is the field that applies statistical and mathematical tools to study relationships between economic quantities. It aims to convert economic theory and observed data into testable statements and numerical estimates so that researchers and policymakers can quantify effects such as how capital, interest rates, or labor affect outcomes of interest. Econometrics sits at the intersection of theory and evidence: it uses assumptions derived from economic reasoning together with data to estimate magnitudes, test hypotheses, and produce forecasts for practical decision making. In this sense it is an applied branch of economics focused on empirical verification and measurement.
Image gallery
1 Image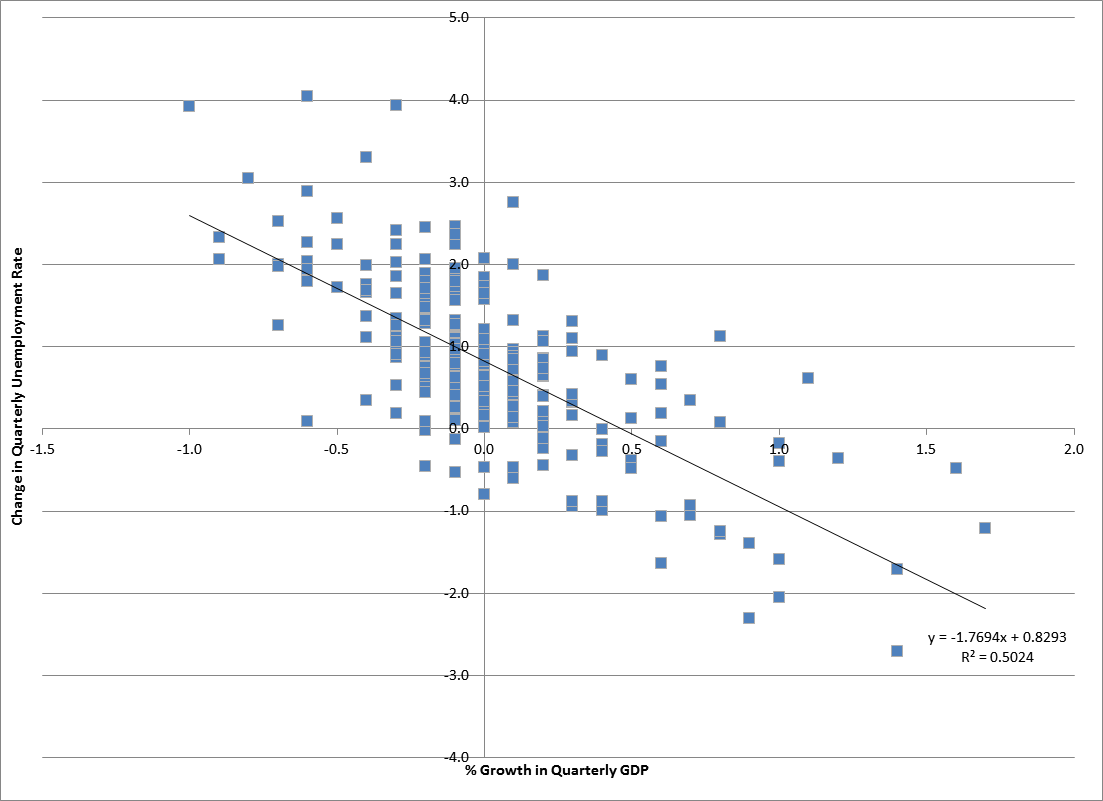
Methods and common models
At the core of econometrics are statistical models that represent simplified versions of economic processes. Economists frequently distinguish between reduced-form models that describe correlations and structural models that aim to represent underlying behavioral mechanisms. Common methods include:
- Ordinary least squares (linear regression) for estimating relationships between variables.
- Time series techniques for data that evolve over time, such as macroeconomic aggregates or financial returns.
- Panel data models that combine cross-sectional and time variation to exploit richer information.
- Instrumental variables and other identification strategies used when explanatory variables are endogenous or correlated with errors.
- Limited dependent variable methods (logit, probit) for binary or categorical outcomes, and maximum likelihood or generalized method of moments for more complex settings.
Practical work often involves checking model assumptions (for example about error distributions, heteroskedasticity, or autocorrelation), performing robustness checks, and using diagnostic tools to guard against biased inference.
History and development
Econometrics emerged in the 20th century as economists sought quantitative tests of theory and improved forecasting tools. Early pioneers combined theoretical models with statistical estimation and, over time, the field expanded through advances in probability theory, computing, and the availability of micro and macro data. Institutional contributions from research centers and methodological debates about identification, causation, and model specification have shaped modern practice. Today econometrics draws on both classical statistical ideas and newer computational techniques.
Applications and an example
Econometric methods are used across many areas: evaluating fiscal or monetary policy, estimating demand and supply, analyzing labor market outcomes, modeling asset prices, and forecasting economic indicators. A simple illustrative application is modeling house prices in a town. An economist might specify a model where a home’s price depends on observable features (size, age, number of rooms), location characteristics (distance to a market, schools, or transport), and neighborhood attributes. Estimation can quantify how much being near a market raises prices, while additional techniques (such as instrumental variables or difference-in-differences) help distinguish causal effects from mere correlations. The model can then be used for forecasting, policy evaluation (for instance, the impact of building a new market), or to inform buyers and planners.
Limitations, challenges and best practices
Econometrics faces several well-known challenges. Data limitations, measurement error, omitted variables, and endogeneity can bias estimates if not properly addressed. Model misspecification and overfitting reduce predictive value out of sample. To improve credibility, practitioners emphasize identification strategies, careful data collection, transparent robustness checks, and out-of-sample validation. Increasingly, econometricians also combine traditional methods with machine learning tools to improve prediction while retaining attention to causal interpretation where required.
Distinctions and notable facts
Econometrics differs from pure statistics in that it typically starts from economic theory and policy questions, focusing on causal interpretation as well as prediction. It overlaps with fields such as statistics, data science, and quantitative finance, but its defining feature is the explicit use of economic models to guide empirical analysis. For those learning the field, mastering both the theoretical foundations and practical data techniques is important: good econometric work balances rigorous methodology with transparent reporting of assumptions and limitations.
For further reading on foundational topics and tools in econometrics, see introductory texts and online resources that cover regression analysis, identification strategies, and time series methods. Many accessible summaries and tutorials are available for newcomers and applied researchers alike via academic courses and institutional guides (economics resources, modeling primers).
Questions and answers
Q: What is econometrics?
A: Econometrics is a branch of economics that uses statistical and mathematical methods to describe the relationship between economic forces such as capital, interest rates, and labor.
Q: What is the purpose of econometrics?
A: The purpose of econometrics is to create models that are simple pictures of the real world and can be used to predict what will happen in the real world.
Q: Can you give an example of econometrics?
A: Yes, an example of econometrics would be looking at the prices of houses in a town and using a model to predict how those prices might change with the addition of a new market.
Q: How can econometrics be used to predict changes in home prices?
A: Econometrics can be used to create a model that shows how factors like proximity to a market can affect home prices. From this model, predictions about how home prices might change in response to changes in the market can be made.
Q: What is an economist?
A: An economist is someone who studies economics.
Q: How might the creation of a new market affect home prices in a town?
A: According to an example given in the text, the creation of a new market in another part of the town might cause home prices in that area to go up, while also bringing down prices near the old market due to increased competition.
Q: Why might sellers near a market be forced to sell their homes for less after the creation of a new market?
A: More sellers than buyers in a market can lead to a reduction in prices, as sellers may be forced to lower their prices in order to find buyers.
Related articles
Author
AlegsaOnline.com Econometrics: Quantitative Analysis of Economic Relationships Leandro Alegsa
URL: https://en.alegsaonline.com/art/29949