
Correlation in statistics: meaning, measures, and practical considerations
Correlation quantifies the relationship between two variables. This article explains types of correlation, common measures, history, applications, and important cautions about interpretation and causation.
Overview
In statistics and probability theory, correlation describes the degree and direction of association between two variables or sets of observations. It is a descriptive summary that can indicate whether values tend to rise and fall together (positive correlation), move in opposite directions (negative correlation), or show no systematic relationship (near zero correlation). Correlation is not a proof of cause-and-effect: two variables can be correlated because of a direct link, a shared cause, or pure coincidence.
Image gallery
3 Images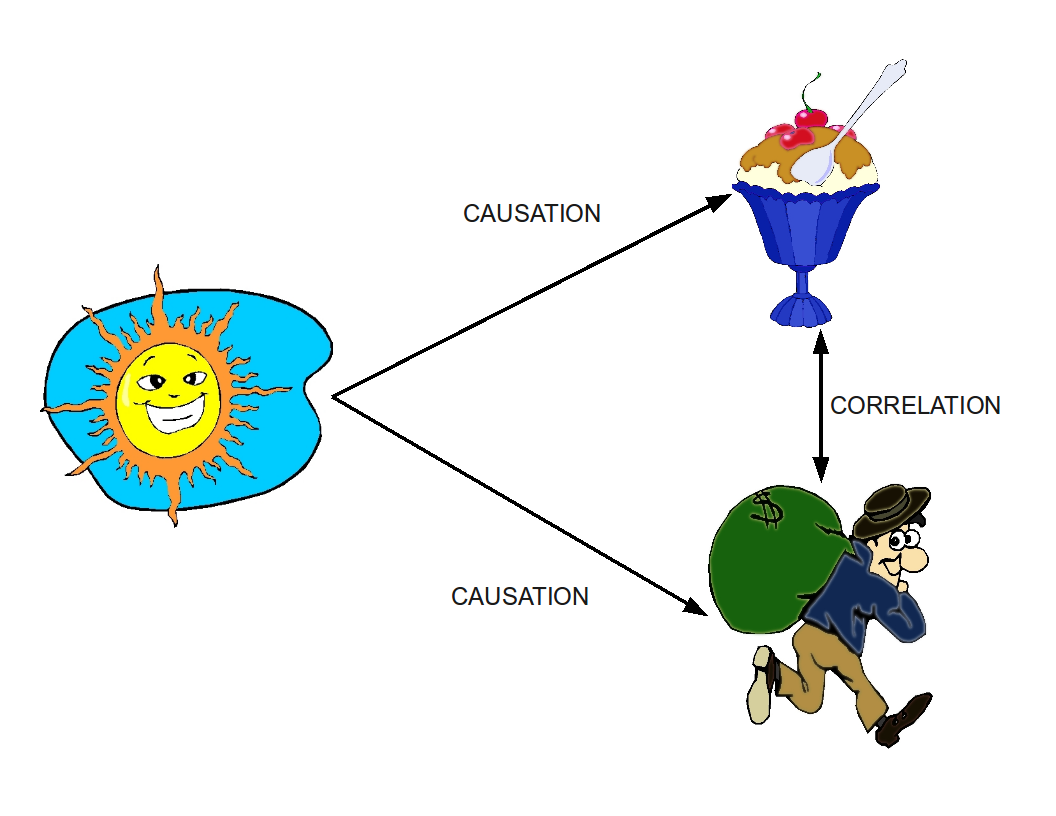

Common measures and characteristics
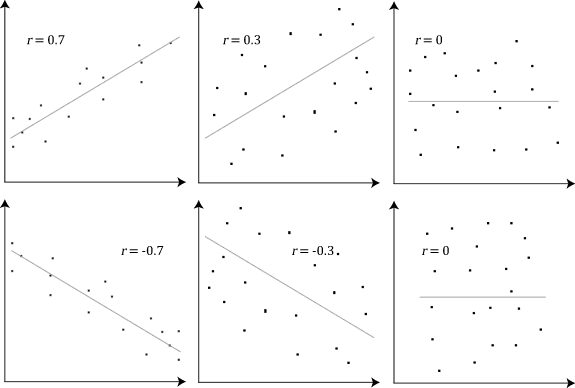
Several numerical measures quantify correlation. The most familiar is the Pearson correlation coefficient (r), which measures linear association and ranges from -1 to +1. Values near +1 indicate a strong positive linear relationship; values near -1 a strong negative linear relationship; values near 0 suggest little or no linear relation. Alternatives handle different data types or relationships:
- Pearson's r — sensitive to linear trends and to outliers.
- Spearman's rank correlation — assesses monotonic but not necessarily linear relationships by using ranks.
- Kendall's tau — another rank-based measure, robust for small samples or many tied ranks.
Other concepts include partial correlation (association after adjusting for other variables), cross-correlation (between time-shifted series), and autocorrelation (a variable correlated with its own past values).
History and theoretical background
The study of correlation developed in the 19th century as statisticians sought ways to summarize relationships between traits. Work by Francis Galton on heredity and Karl Pearson formalized early measures of association; Pearson introduced the correlation coefficient widely used today. The mathematical framework ties correlation to covariance and standard deviations, and statistical inference for correlation commonly uses hypothesis tests and confidence intervals.
Applications and examples
Correlation is widely applied in sciences, finance, medicine, and social research. Examples include the positive correlation between height and weight in populations, the negative relationship often seen between interest rates and bond prices, and autocorrelation patterns in economic time series. Visual tools such as a scatter graph help reveal patterns; fitting a line of best fit can illustrate linear association. Datasets and study design affect which correlation measure is appropriate: continuous measurements often use Pearson's r, while ordinal data favor rank correlations. See also related discussions about data sets and data quality when interpreting results.
Common pitfalls and distinctions
- Correlation vs causation: Correlation alone cannot establish causality; further study or experimental design is required.
- Linearity assumption: Pearson's r can be misleading if a relationship is nonlinear but strong (e.g., quadratic).
- Outliers and sample size: Extreme values or small samples can distort estimated correlation coefficients and statistical significance.
- Confounding variables: A third factor may induce correlation between two observed variables.
Interpreting correlation responsibly requires attention to measurement scales, underlying distributions, and the research context. While simple to compute, correlation is a starting point for understanding relationships, not a definitive explanation of why they exist.
Questions and answers
Q: What is correlation?
A: Correlation is a way to indicate how closely related two sets of data are.
Q: Does correlation mean that one set of data causes the other?
A: No, correlation does not always mean that one set of data causes the other. In fact, there is often a third factor involved.
Q: What are the two directions of correlation?
A: The two directions of correlation are positive and negative.
Q: What does a positive correlation mean?
A: A positive correlation means that the two sets of data go up together.
Q: What does a negative correlation mean?
A: A negative correlation means that one set of data goes up while the other goes down.
Q: Are there different measurements of correlation?
A: Yes, lots of different measurements of correlation are used for different situations.
Q: How do people often show the direction of correlation on a scatter graph?
A: People often draw a line of best fit to show the direction of the correlation on a scatter graph.
Related articles
Author
AlegsaOnline.com Correlation in statistics: meaning, measures, and practical considerations Leandro Alegsa
URL: https://en.alegsaonline.com/art/23228