
Confidence interval
A confidence interval quantifies uncertainty in an estimate by giving a range of plausible values for an unknown parameter together with a confidence level.
Overview
A confidence interval (CI) expresses the uncertainty of a statistical estimate by providing a range of values that, under a specified method, is expected to contain the true but unknown parameter. Instead of reporting a single point estimate, a CI gives lower and upper confidence limits and an associated confidence level (commonly 90%, 95% or 99%). For basic background on related concepts see statistics.
Image gallery
2 Images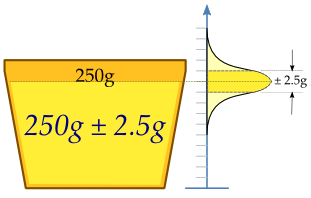

How it is constructed
Most confidence intervals follow the form: point estimate ± (critical value × standard error). The point estimate may be a sample mean, proportion, regression coefficient or other statistic. The critical value depends on the assumed sampling distribution (for example, a normal or t distribution) and the chosen confidence level. When the population variance is unknown and the sample is small, practitioners often use the Student's t distribution; when assumptions are questionable they may use nonparametric approaches such as the bootstrap. For formal definitions and methods see interval estimation and estimation theory.
Interpretation and common misconceptions
In the frequentist framework, a 95% confidence level means that if the same sampling procedure were repeated many times and a 95% CI computed each time, approximately 95% of those intervals would contain the true parameter. It is incorrect to say that there is a 95% probability that a specific interval from a single study contains the parameter; after the data are observed the parameter is fixed and the interval either does or does not contain it. This subtlety is often a source of confusion for readers and decision makers; compare this with the Bayesian credible interval, which has a different interpretation based on probability statements about the parameter itself (Bayesian approaches).
Uses and examples
Confidence intervals are widely used in surveys, clinical trials, quality control and many other applied fields to communicate precision. For example, instead of stating a single estimated mean traffic count, analysts might report 400 ± 10 as a simple interval indicating sampling uncertainty. The width of a CI depends on sample size, variability in the data and the chosen confidence level: larger samples and lower variability give narrower intervals, while higher confidence levels produce wider intervals.
Variations, assumptions and computation
Several methods produce confidence intervals: analytic formulas (normal- or t-based), exact methods for discrete data, bootstrap percentile or bias-corrected intervals, and profile-likelihood intervals for complex models. Most standard CIs rely on assumptions such as independent random sampling and an approximately known sampling distribution (often normal); violations can reduce validity. Robust or resampling-based methods help when those assumptions fail. Software packages routinely compute CIs; consult methodological references for the appropriate choice (methods, resampling).
History and notable facts
The modern concept of the confidence interval is closely associated with the work of Jerzy Neyman in the 1930s, who formalized interval estimation within the frequentist paradigm. Confidence intervals are linked to hypothesis testing: a two-sided 95% CI for a parameter excludes any null hypothesis value that would be rejected at the 5% significance level. For further reading and practical examples see additional resources.

Definition
For a fixed given γ , a γ
, a γ  -confidence interval for
  to the confidence level γ
  (also: a γ -confidence interval) by the two - based on a random sample
  - based on a random sample
 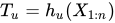 and
and 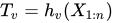 which are

satisfy. The statistics  and
and  are the bounds of the confidence interval, for which always
  assumed. The confidence level γ is also called the coverage probability. The realizations
  and
and  of and respectively, form the estimation interval
 ![{\displaystyle [t_{u},t_{v}]}](https://www.alegsaonline.com/image/3d416c138a33e1608518933df283067ef8f9924b.svg) . The bounds of the confidence interval are functions of the random sample and therefore also random. In contrast, the unknown parameter is fixed. Repeating the random experiment in an identical way, a γ -confidence interval will cover the unknown parameter in γ all cases. However, since the unknown parameter is not a random variable, one cannot say that lies in a γ -confidence interval with probability γ Such an interpretation is reserved for the Bayesian counterpart of confidence interval, called credibility intervals. The confidence level γ is also called the coverage probability. Often one sets γ
. The bounds of the confidence interval are functions of the random sample and therefore also random. In contrast, the unknown parameter is fixed. Repeating the random experiment in an identical way, a γ -confidence interval will cover the unknown parameter in γ all cases. However, since the unknown parameter is not a random variable, one cannot say that lies in a γ -confidence interval with probability γ Such an interpretation is reserved for the Bayesian counterpart of confidence interval, called credibility intervals. The confidence level γ is also called the coverage probability. Often one sets γ  . The probability
  can be interpreted as a relative frequency: If one uses intervals for a large number of confidence estimates, each of which has the level the relative frequency with which the concrete intervals cover the parameter approaches the value .
Formal definition
General conditions
Given a statistical model  and a function
 ,
,
which is also called parameter function in the parametric case. The set Γ  contains the values that can be the result of an estimation. Usually, Γ
Confidence interval
An illustration
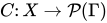
is called a confidence interval, confidence region, range estimator, or range estimator if it satisfies the following condition:
- For all γ
 , the set
 contained in (M)
Thus, a confidence region is a mapping that assigns to each observation an  initially arbitrary subset of Γ (
  is here the power set of the set Γ , that is, the set of all subsets of Γ )
Condition (M) ensures that all sets can be assigned  a probability. This is needed to define the confidence level.
Confidence interval
If Γ  and if
  always an interval for any , then
  also called a confidence interval.
If confidence intervals are defined in the form
![{\displaystyle C_{1}(x)=(-\infty ,b^{+}(x)],\;C_{2}(x)=[b^{-}(x),b^{+}(x)]\;\;{\text{oder}}\;\;C_{3}(x)=[b^{-}(x),+\infty )}](https://www.alegsaonline.com/image/b76cb2b4a68c4fa2c546cd551e822dbb3fe98d0a.svg) ,
,
is defined, then  also called the upper confidence bound and
  the lower confidence bound.
Confidence level and level of error
Given a confidence region . Then is called a confidence region at the confidence level or certainty level if
 .
.
The value α  is then also called the level of error. A more general formulation is possible with shape hypotheses (see Shape Hypotheses#Confidence Ranges for Shape Hypotheses).
For the above-mentioned special cases with confidence intervals with upper and lower confidence limits, the following is thus obtained

respectively

and

Questions and answers
Q: What is a confidence interval in statistics?
A: A confidence interval is a special interval used to estimate a parameter, such as the population mean, giving a range of acceptable values for the parameter instead of a single value.
Q: Why is a confidence interval used instead of a single value?
A: A confidence interval is used instead of a single value to account for the uncertainty of estimating a parameter based on a sample, and to give a likelihood that the real value of the parameter is within the interval.
Q: What is a confidence level?
A: A confidence level is the likelihood that the parameter being estimated is within the confidence interval, and is often given as a percentage (e.g. 95% confidence interval).
Q: What are confidence limits?
A: Confidence limits are the end points of a confidence interval, which define the range of acceptable values for the parameter being estimated.
Q: How does the confidence level affect the confidence interval?
A: In a given estimation procedure, the higher the confidence level, the wider the confidence interval will be.
Q: What assumptions are required to calculate a confidence interval?
A: The calculation of a confidence interval generally requires assumptions about the nature of the estimation process, such as the assumption that the distribution of the population from which the sample came is normal.
Q: Are confidence intervals robust statistics?
A: Confidence intervals, as discussed below, are not robust statistics, though adjustments can be made to add robustness.
Related articles
Author
AlegsaOnline.com Confidence interval Leandro Alegsa
URL: https://en.alegsaonline.com/art/22481