
Chi-square distribution (χ²): definition, properties, and applications
A continuous probability distribution for the sum of squared standard normals. Explains definition, degrees of freedom, main properties, history and common statistical uses such as tests and variance inference.
The chi-square distribution is a continuous probability distribution that describes the sum of the squares of independent standard normal random variables. Formally, if Z1, Z2, ..., Zν are independent standard normal variables, then the sum Z1² + Z2² + ... + Zν² has a chi-square distribution with ν degrees of freedom. It arises naturally in probability theory and in many procedures of statistics. The distribution is commonly denoted χ²(ν) and is a special case of the gamma family of distributions.
Image gallery
3 Images


Key characteristics
The chi-square distribution is determined entirely by its degrees of freedom, ν, which is a positive parameter that often equals the number of independent contributions to the sum of squares. Important numerical properties include a mean equal to ν and a variance equal to 2ν. The shape is right-skewed for small ν and becomes more symmetric as ν increases; for large ν the distribution is approximately normal. In analytical terms it can be expressed using the gamma function and its density depends on ν/2 as a shape parameter and on 2 as a scale parameter.
Origins and mathematical context
Historically, the chi-square distribution was developed in the early 20th century in connection with testing hypotheses about variances and goodness-of-fit problems. Its foundation rests on the fact that squared standard normal variables add in a way that produces this family of distributions. Because of this additive property and its relationship to sums of independent normals, the chi-square distribution plays a central role in classical inferential theory and in asymptotic results such as likelihood-ratio tests.
Common uses and examples
Practical applications of the chi-square distribution include:
- Goodness-of-fit testing: comparing observed counts to expected counts under a model.
- Tests of independence or homogeneity in contingency tables.
- Inference about a normal population's variance: confidence intervals and tests for σ².
- Asymptotic reference distribution for many test statistics, including likelihood-ratio tests when the null hypothesis is true.
These testing uses are reliable under assumptions such as independence of observations and adequate sample size; many references summarize these conditions and practical approximations. See general theoretical references on theoretical distributions and detailed discussions of statistical significance and confidence intervals for context.
Notable facts and distinctions
Some additional points to keep in mind: the chi-square distribution is not symmetric unless ν is large, and its quantiles are widely tabulated and implemented in statistical software. It is distinct from other distributions despite close connections — for example, it is a scaled gamma distribution rather than a normal one — and it is only defined for nonnegative values. Many familiar tests reduce to chi-square comparisons under their null hypotheses; those proofs rely on independence and correct model specification, including the assumption sometimes called the null hypothesis being true.
For practitioners, the chi-square framework provides an interpretable scale for measuring discrepancy: larger observed χ² values indicate greater disagreement between data and model expectations. Because of its mathematical tractability and direct link to sums of squared normals, the chi-square distribution remains a foundational tool in both theoretical and applied statistics.

Definition
The square of a standard normally distributed random variable  follows a chi-squared distribution with one degree of freedom:
 .
.
Furthermore, if 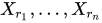 are jointly stochastically independent chi-squared distributed random variables, then their sum is chi-squared distributed with the sum of the respective degrees of freedom
 .
.
Thus, the chi-squared distribution is reproducible. Let be  stochastically independent and standard-normally distributed random variables, then their sum-of-squares
  that it is chi-squared distributed with the number of degrees of freedom
  :
:
 .
.
The character  is a shorthand notation for "follows the distribution". For example,
  ; also often written as
  The random variable follows a chi-squared distribution with number of degrees of freedom . The sum of squared quantities cannot take negative values.
In contrast, for the simple sum  with distribution symmetric about the zero point.

Density
The density  of the χ
  distribution with degrees of freedom has the form:

Here Γ  stands for the gamma function. The values of Γ
  can be calculated with

 .
.
Calculate
Distribution function
The distribution function can be written using the regularized incomplete gamma function:

If is a natural number, then the distribution function can be represented (more or less) elementarily:


where  denotes the error function. The distribution function describes the probability that χ
 ![[0,x]](https://www.alegsaonline.com/image/725684c883c7ef386e8a0fe4d111e72c565747ed.svg) lies in the interval
lies in the interval
Properties
Expected value
The expected value of the chi-square distribution with degrees of freedom is equal to the number of degrees of freedom
 .
.
Thus, assuming a standard normally distributed population, if the variance of the population is correctly estimated, the value χ  should be close to 1.
Variance
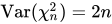
The variance of the chi-square distribution with degrees of freedom is equal to 2 times the number of degrees of freedom
 .
.
Mode
The mode of the chi-squared distribution with degrees of freedom is  for
for  .
.
Skew
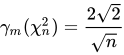
The skewness γ  of the chi-squared distribution with degrees of freedom is
 .
.
The chi-square distribution has a positive skewness, i.e., it is left-skewed or right-skewed. The higher the number of degrees of freedom the less skewed the distribution is.
Kurtosis
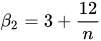
The kurtosis (kurtosis) β  of the chi-squared distribution with degrees of freedom is given by
 .
.
The excess γ  over the normal distribution thus results in γ
  . Therefore, the higher the number of degrees of freedom , the lower the excess.
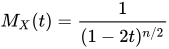
Moment generating function
The moment generating function for  has the form
 .
.
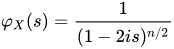
Characteristic function
The characteristic function for from the moment generating function as:
 .
.
Entropy
The entropy of the chi-squared distribution (expressed in nats) is

where ψ(p) denotes the digamma function.
Non-Central Chi-Square Distribution
If the normally distributed random variables are not  centered with respect to their expected value μ if not all μ
  ), the noncentral chi-squared distribution is obtained. It has as a second parameter besides the noncentrality parameter λ
Let  , then
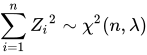 with λ
  .
.
In particular, it follows from 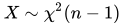 and
and 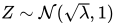 that
that  is
is
A second way to generate a non-central chi-squared distribution is as a mixture distribution of the central chi-squared distribution. Here is
 ,
,
if is drawn  from a Poisson distribution.
Density function
The density function of the non-central chi-squared distribution is
 for
for  ,
,  for
for
The sum over j leads to a modified Bessel function of first genus  . This gives the density function the following form:
 for .
for .
Expected value and variance of the noncentral chi-squared distribution  and
and  into the corresponding expressions of the central chi-squared distribution, as does the density itself when λ
Distribution function
The distribution function of the noncentral chi-squared distribution can be  expressed using the Marcum function Q

Example
Take measurements of a quantity  , which come from a normally distributed population. Let be
  the empirical mean of the measured values and
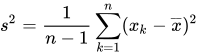
the corrected sample variance. Then, for example, the 95% confidence interval for the variance of the population σ  specified:
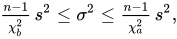
where χ  by
by  and χ
and χ  by
by  , and therefore also χ
  . The limits follow from the fact that
 is distributed as χ
Derivation of the distribution of the sample variance
Let  a sample of measurements, drawn from a normally distributed random variable
  with empirical mean
 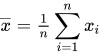 and sample variance
 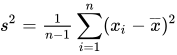 as estimators for expected value μ
  and variance σ the population.
Then it can be shown, that 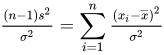 is distributed as χ .
To do this, Helmert  transforms the into new variables
  using an orthonormal linear combination. The transformation is:
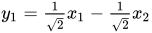




The new independent variables  are normally distributed like with equal variance σ
  , but with expected value
  both due to the convolution invariance of the normal distribution.
Moreover, for the coefficients  in
in 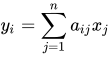 (if
(if  ,
,  ) because of orthonormality
 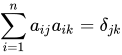 (Kronecker delta) and thus

Therefore, the sum of the squares of the deviations is now given by

and finally after division by σ
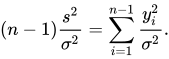
The expression on the left hand side is apparently distributed like a sum of squared standard normally distributed independent variables with  summands, as required for χ
Thus, the sum is chi-squared distributed with degrees of freedom 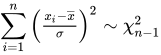 , while by definition of the chi-squared sum
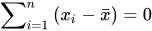
 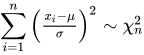 . One degree of freedom is "consumed" here, because due to the centroid property of the empirical mean
  the last variation is
  already
  determined by the first Consequently, only variances vary freely and one therefore averages the empirical variance by dividing by the number of degrees of freedom
Relationship to other distributions
Relationship to gamma distribution
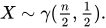
The chi-squared distribution is a special case of the gamma distribution. If , then
Relationship to normal distribution
- Let be independent and standard normally distributed random variables, then their sum of squares that it is chi-squared distributed with the number of degrees of freedom :
.
- For
 , is
, is  approximately standard normally distributed.
- For
 the random variable X n {\displaystyle
  normally distributed, with expected value n {\displaystyle n} standard deviation 2 n {\displaystyle for a noncentral chi-squared distribution with expected value and standard deviation
  .
.
Relationship to exponential distribution
A chi-squared distribution with 2 degrees of freedom is an exponential distribution  with parameter λ
  .
.
Relationship to Erlang distribution
A chi-squared distribution with  degrees of freedom is identical to an Erlang distribution
  with degrees of freedom and λ .
Relationship to F-Distribution
Let χ  and χ be
  independent chi-squared distributed random variables with
  and
and  degrees of freedom, then the quotient is
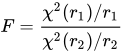
F-distributed with numerator degrees of freedom and denominator degrees of freedom.
Relationship to Poisson distribution
The distribution functions of the Poisson distribution and the chi-square distribution are related in the following way:
The probability of finding or more events in an interval within which one expects on average λ  events is like the probability that the value of χ
  Namely, it holds
 ,
,
with  and as regularized gamma functions.
Relationship to continuous uniform distribution
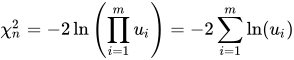
For even one can form the χ -distribution as an
  -fold convolution using the uniformly continuous density
  :
:
 ,
,
where the  are independent uniformly continuously distributed random variables.
For odd , however, the following applies
![\chi _{n}^{2}=\chi _{{n-1}}^{2}+\left[{\mathcal {N}}(0,1)\right]^{{2}}.](https://www.alegsaonline.com/image/c344c9eadb38dcefc41588f70302c7177a0c68bf.svg)

Derivation of the density function
The density of the random variable χ  , with
  independent and standard normally distributed, is given by the joint density of the random variables . This joint density is the -fold product of the standard normal distribution density:

For the density we are looking for:
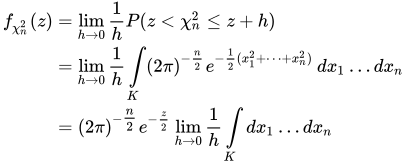
where 
In the limit, the sum in the argument of the exponential function is equal to  . It can be shown that the integrand can be drawn as
  before the integral and the limit.
The remaining integral

corresponds to the volume of the shell between the sphere with radius  and the sphere with radius
  ,
,
where gives 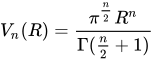 the volume of the n-dimensional sphere with radius R.
It follows: 
and after substituting into the expression for the density we are looking for:
Quantile function
The quantile function  the chi-squared distribution is the solution of the equation
 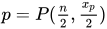 and thus in principle can be calculated via the inverse function. Concretely applies here

with  as inverse of the regularized incomplete gamma function. This value is entered in the quantile table under the coordinates
  and
and
Quantile function for small sample size
For a few values (1, 2, 4) one can also specify the quantile function alternatively:



where denotes the error function,  denotes the lower branch of the Lambertian W-function, and
  denotes the Euler number.
Approximation of the quantile function for fixed probabilities
For certain fixed probabilities the associated quantiles obtained by the simple sample size function

with parameters  from the table, where
  denotes the signum function, which simply represents the sign of its argument:
|
| 0,005 | 0,01 | 0,025 | 0,05 | 0,1 | 0,5 | 0,9 | 0,95 | 0,975 | 0,99 | 0,995 |
|
| −3,643 | −3,298 | −2,787 | −2,34 | −1,83 | 0 | 1,82 | 2,34 | 2,78 | 3,29 | 3,63 |
|
| 1,8947 | 1,327 | 0,6 | 0,082 | −0,348 | −0,67 | −0,58 | −0,15 | 0,43 | 1,3 | 2 |
|
| −2,14 | −1,46 | −0,69 | −0,24 | 0 | 0,104 | −0,34 | −0,4 | −0,4 | −0,3 | 0 |


Comparison with a χ  table shows
  relative error below 0.4% for and n > 10
  Since the χ -distribution for large transitions to a normal distribution with standard deviation
  , the parameter
  from the table, which has been freely adjusted here, at the corresponding probability approximately the size of
  times the quantile of the normal distribution (
  ), where
  denotes the inverse of the error function.
The 95% confidence interval for the variance of the population from the Example section can be obtained, e.g. with the two functions from the lines with  and
and  plotted in a simple way as a function of .
The median is located in the column of the table with  .
.
Related articles
Author
AlegsaOnline.com Chi-square distribution (χ²): definition, properties, and applications Leandro Alegsa
URL: https://en.alegsaonline.com/art/19469